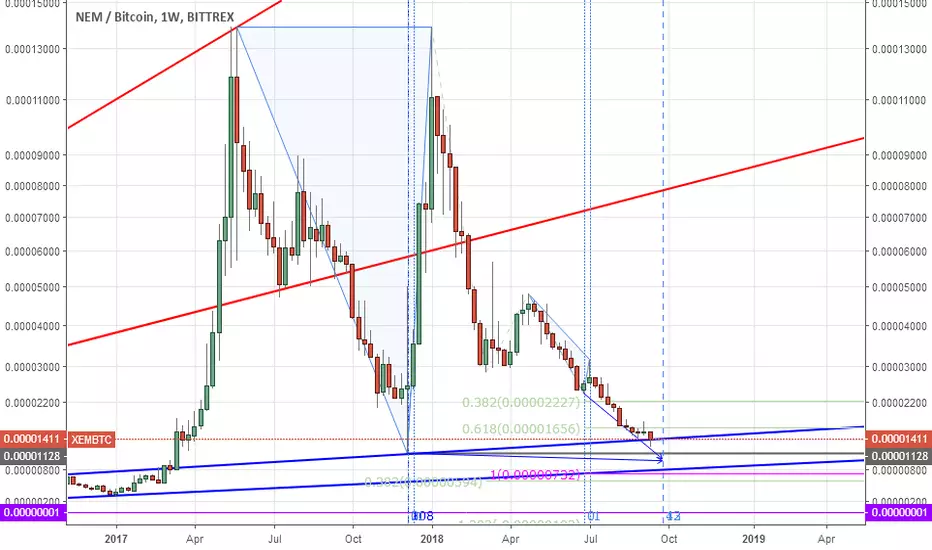
showing here the same possible reversal week 24-30 September. Ermanometry in case of XEM does not work however so precise in comparison to BTCUSD weekly chart (after all time high made by Bitcoin - before that time ermanometric calculations seem not to work properly). But XEMBTC chart suggests possible nearing of ending this bear market here. Some spike up should be drawed by market forces here. The only question is when.
注释
XEMUSD have one week eralier his ermanometric, turning point. That from 13 August gave limited effect.
免责声明
这些信息和出版物并非旨在提供,也不构成TradingView提供或认可的任何形式的财务、投资、交易或其他类型的建议或推荐。请阅读使用条款了解更多信息。