
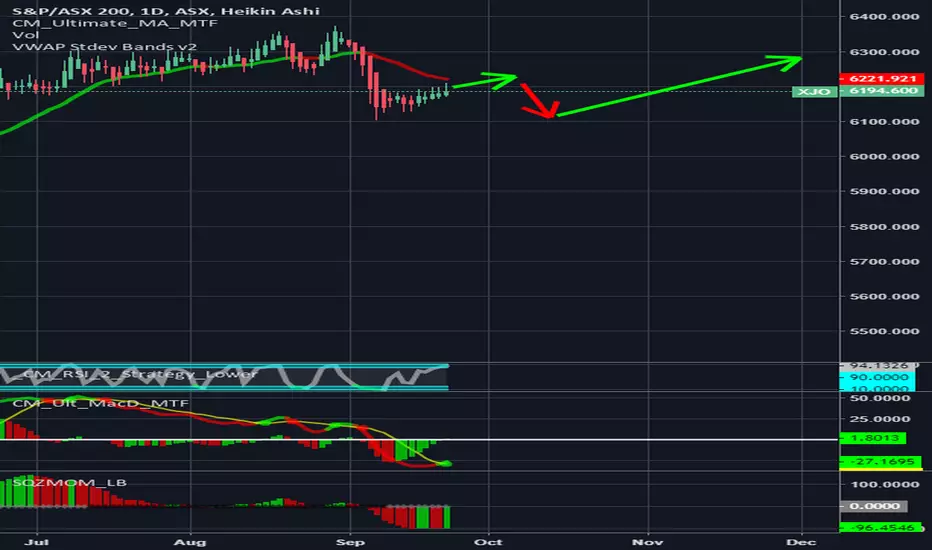
- Chris Moody's MacD indicator showing buy signal right now
- Squeeze Momentum showing it's in the good deal territory
- Candles are below the Chris Moody's MA
- As soon as you see 2 consecutive red candles on the 1 DAY Heikin Ashi chart for ASX:XJO, that's your stop loss, get out.
- ...otherwise I don't see why it can't hit 6300 even with one pullback.

免责声明
这些信息和出版物并非旨在提供,也不构成TradingView提供或认可的任何形式的财务、投资、交易或其他类型的建议或推荐。请阅读使用条款了解更多信息。