
Hello guys,
XLM Chart :
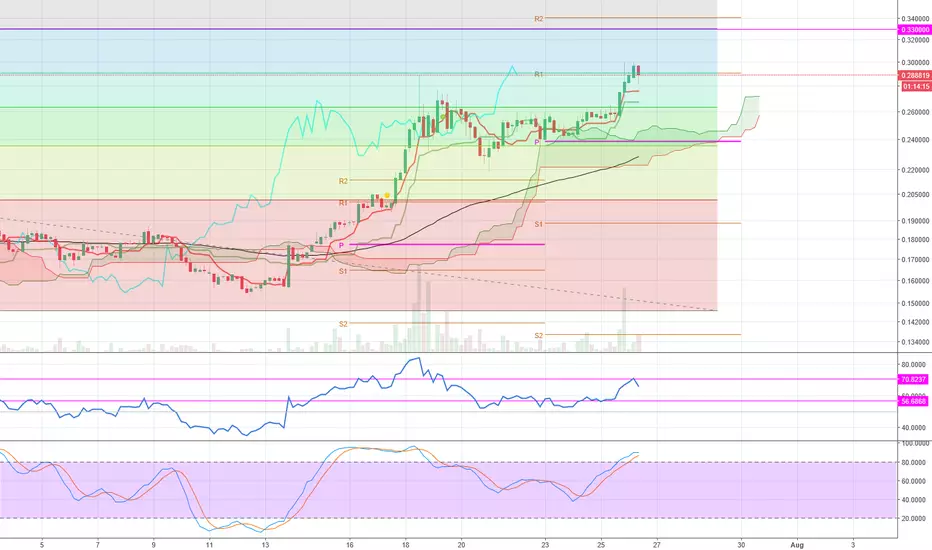
- We hit R1 weekly on H4 chart
- Little pullback on the RSI (21) 70%
- We need to have a signal from a bullish candlestick + break 70% rsi to have a bullish Momentum to go to the weekly R2 and next fibonacci level (0.33€) for a take profit !
Be patient, we need to have a new bullish signal for the next take profit !
XLM Chart :
- We hit R1 weekly on H4 chart
- Little pullback on the RSI (21) 70%
- We need to have a signal from a bullish candlestick + break 70% rsi to have a bullish Momentum to go to the weekly R2 and next fibonacci level (0.33€) for a take profit !
Be patient, we need to have a new bullish signal for the next take profit !

免责声明
这些信息和出版物并非旨在提供,也不构成TradingView提供或认可的任何形式的财务、投资、交易或其他类型的建议或推荐。请阅读使用条款了解更多信息。
免责声明
这些信息和出版物并非旨在提供,也不构成TradingView提供或认可的任何形式的财务、投资、交易或其他类型的建议或推荐。请阅读使用条款了解更多信息。