
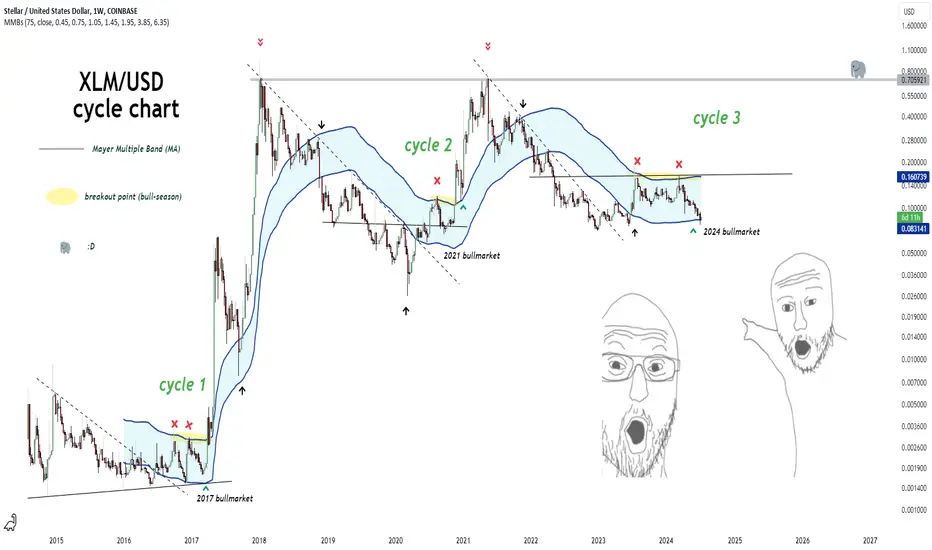
XLM/USD CYCLE CHART (2014-2024)
10 year >> 3 cycle >> 3 bullrun.
Now we are on Bullrun Eve.
2017 vs. 2021 vs. 2024
-We have barred the gates… but cannot hold them for long. The ground shakes.' "'Drums… drums… in the deep.'"
"'We cannot get out. A shadow moves in the dark.'"
"'We cannot get out…'" "'They are coming!'"
#XLM $LSE:XLM
Indicator: Mayer Multiple Bands (75MA)

Follow me on X
Subscribe
x.com/Cryptollica/creator-subscriptions/subscribe
Subscribe
x.com/Cryptollica/creator-subscriptions/subscribe
免责声明
这些信息和出版物并非旨在提供,也不构成TradingView提供或认可的任何形式的财务、投资、交易或其他类型的建议或推荐。请阅读使用条款了解更多信息。
Follow me on X
Subscribe
x.com/Cryptollica/creator-subscriptions/subscribe
Subscribe
x.com/Cryptollica/creator-subscriptions/subscribe
免责声明
这些信息和出版物并非旨在提供,也不构成TradingView提供或认可的任何形式的财务、投资、交易或其他类型的建议或推荐。请阅读使用条款了解更多信息。