XMRUSDT H1
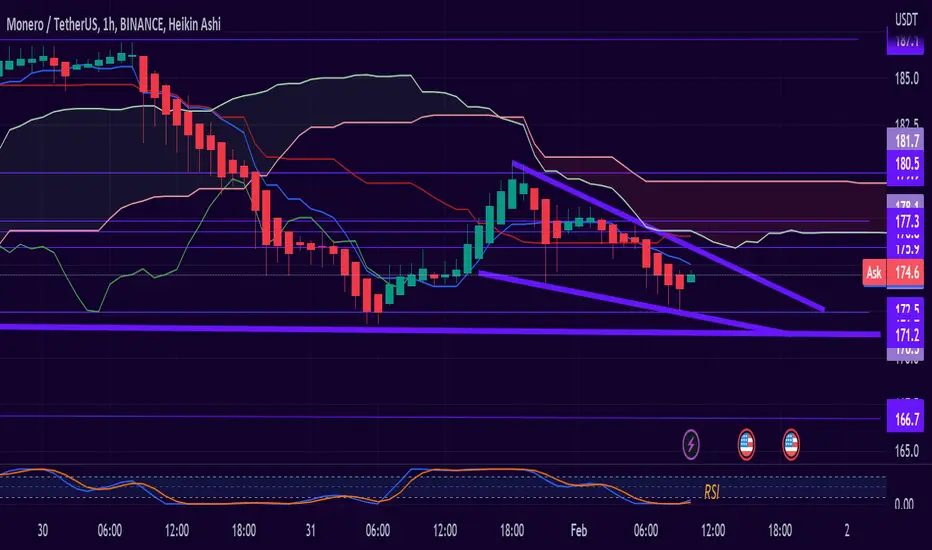
Looking at the short-term H1 chart, my overall bias for XMRUSDT is bearish due to the current price being below the Ichimoku cloud, indicating a bear market.
As the RSI shows the exhaustion of selling forces , a limit buy entry at 171.22 where it would make a triple bottom and the support of the lower line of the Keltner Channel .
Key support levels: 171.2 / 166.7
Main Resistance Levels: 175.9 / 179.9
✅RSI: Exhaustion of selling forces.
✅MM200: At the height of 177.3
As the RSI shows the exhaustion of selling forces , a limit buy entry at 171.22 where it would make a triple bottom and the support of the lower line of the Keltner Channel .
Key support levels: 171.2 / 166.7
Main Resistance Levels: 175.9 / 179.9
✅RSI: Exhaustion of selling forces.
✅MM200: At the height of 177.3

Renato Ulianov | Market Analysis & Trading
YouTube: youtube.com/@TradewithRenatoUlianov
Disclaimer: All content is for educational and informational purposes only and does not constitute financial advice.
YouTube: youtube.com/@TradewithRenatoUlianov
Disclaimer: All content is for educational and informational purposes only and does not constitute financial advice.
免责声明
这些信息和出版物并非旨在提供,也不构成TradingView提供或认可的任何形式的财务、投资、交易或其他类型的建议或推荐。请阅读使用条款了解更多信息。
Renato Ulianov | Market Analysis & Trading
YouTube: youtube.com/@TradewithRenatoUlianov
Disclaimer: All content is for educational and informational purposes only and does not constitute financial advice.
YouTube: youtube.com/@TradewithRenatoUlianov
Disclaimer: All content is for educational and informational purposes only and does not constitute financial advice.
免责声明
这些信息和出版物并非旨在提供,也不构成TradingView提供或认可的任何形式的财务、投资、交易或其他类型的建议或推荐。请阅读使用条款了解更多信息。