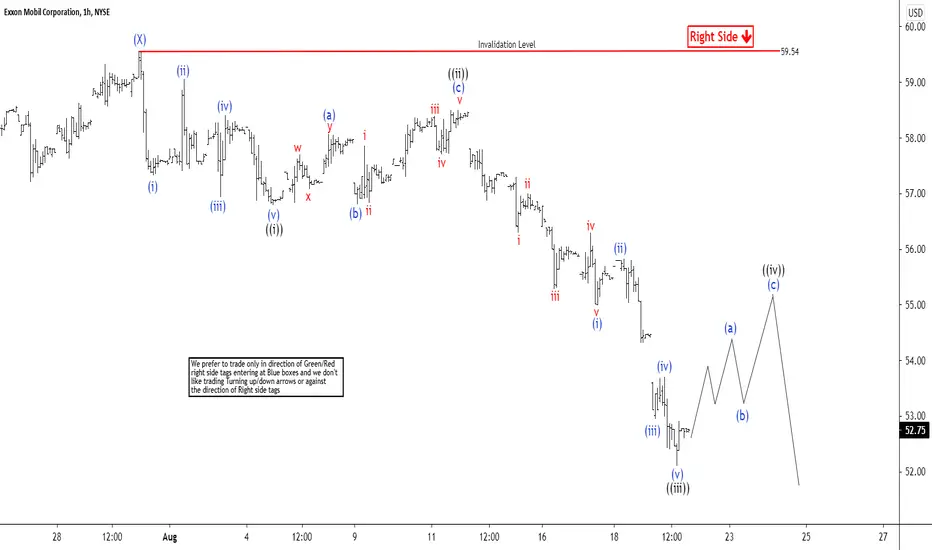
Short-term Elliott wave view in Exxon Mobil (XOM) suggests that the cycle from June 25, 2021 high is unfolding as a double three Elliott Wave structure. Down from June 25, wave (W) ended at 54.59 and rally in wave (X) ended at 59.33. The stock has broken below wave (W), creating an incomplete bearish sequence from June 25 peak favoring more downside. The break below wave (W) also confirms that wave (Y) lower is in progress.
Internal subdivision of wave (Y) is unfolding as a zigzag in lesser degree. Down from wave (X), wave ((i)) ended at 56.79 and rally in wave ((ii)) ended at 58.50. The stock then extended lower in wave ((iii)) towards 52.10. Expect rally in wave ((iv)) to fail in 3, 7, or 11 swing for further downside in wave ((v)) of A. Then it should correct the entire 5 waves down in larger degree wave B before the decline resumes. Potential target for wave ((iv)) correction is 23.6 – 38.2% Fibonacci retracement of wave ((iii)) at 53.62 – 54.55. Near term, as far as pivot at 59.54 high remains intact, expect rally to fail in 3, 7, or 11 swing for further downside.
Internal subdivision of wave (Y) is unfolding as a zigzag in lesser degree. Down from wave (X), wave ((i)) ended at 56.79 and rally in wave ((ii)) ended at 58.50. The stock then extended lower in wave ((iii)) towards 52.10. Expect rally in wave ((iv)) to fail in 3, 7, or 11 swing for further downside in wave ((v)) of A. Then it should correct the entire 5 waves down in larger degree wave B before the decline resumes. Potential target for wave ((iv)) correction is 23.6 – 38.2% Fibonacci retracement of wave ((iii)) at 53.62 – 54.55. Near term, as far as pivot at 59.54 high remains intact, expect rally to fail in 3, 7, or 11 swing for further downside.

免责声明
这些信息和出版物并非旨在提供,也不构成TradingView提供或认可的任何形式的财务、投资、交易或其他类型的建议或推荐。请阅读使用条款了解更多信息。
免责声明
这些信息和出版物并非旨在提供,也不构成TradingView提供或认可的任何形式的财务、投资、交易或其他类型的建议或推荐。请阅读使用条款了解更多信息。