
Once an altcoin starts to move, any "strong" jump brings out flashes of the multiple years-long bear market... "Is this the top...?"
"Will prices start dropping now?"
Zooming out and looking at the bigger picture can surely help us with answering these questions.
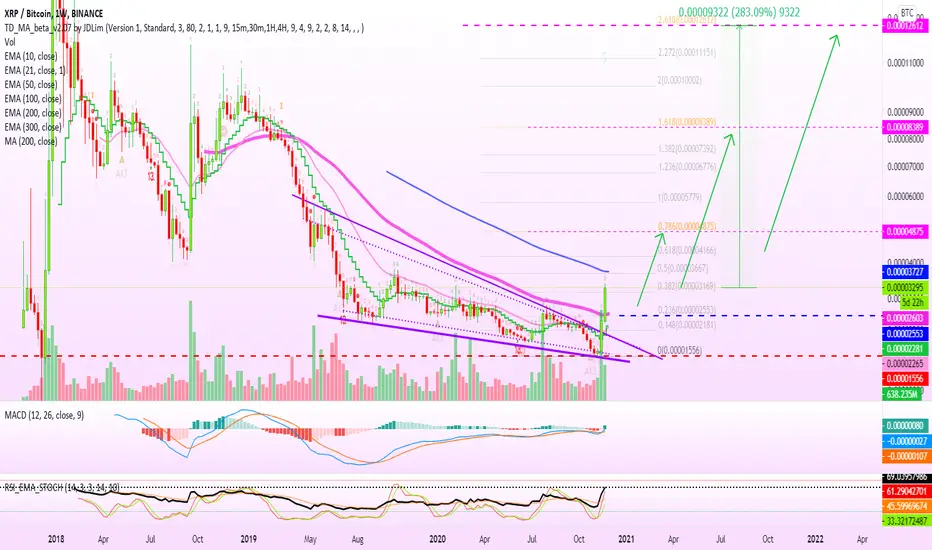
Here we are looking at XRPBTC on the weekly timeframe, which we also call the 'long-term' chart.
Notice that prices just moved above EMA50 for the first time since 2019.
Once we see weekly above EMA50, it means that this is only getting started and there is room for more green.
On the chart above, you can see the fib. levels and over 280% of potential growth... This is only based on the Sept. 2018 high, there can be more.
Remember, just as prices can hit new All-Time Low when they drop, they can also hit new All-Time Highs when they move up.
Namaste!
"Will prices start dropping now?"
Zooming out and looking at the bigger picture can surely help us with answering these questions.
Here we are looking at XRPBTC on the weekly timeframe, which we also call the 'long-term' chart.
Notice that prices just moved above EMA50 for the first time since 2019.
Once we see weekly above EMA50, it means that this is only getting started and there is room for more green.
On the chart above, you can see the fib. levels and over 280% of potential growth... This is only based on the Sept. 2018 high, there can be more.
Remember, just as prices can hit new All-Time Low when they drop, they can also hit new All-Time Highs when they move up.
Namaste!
注释
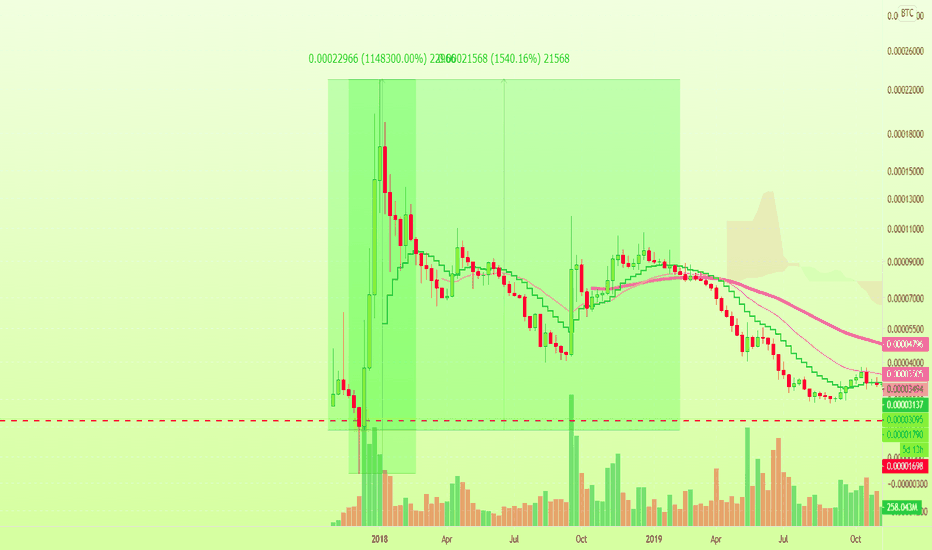
Previous chartsNov 3. Ripple (XRP) Falling Wedge + Bullish Divergence (1,148,300%)
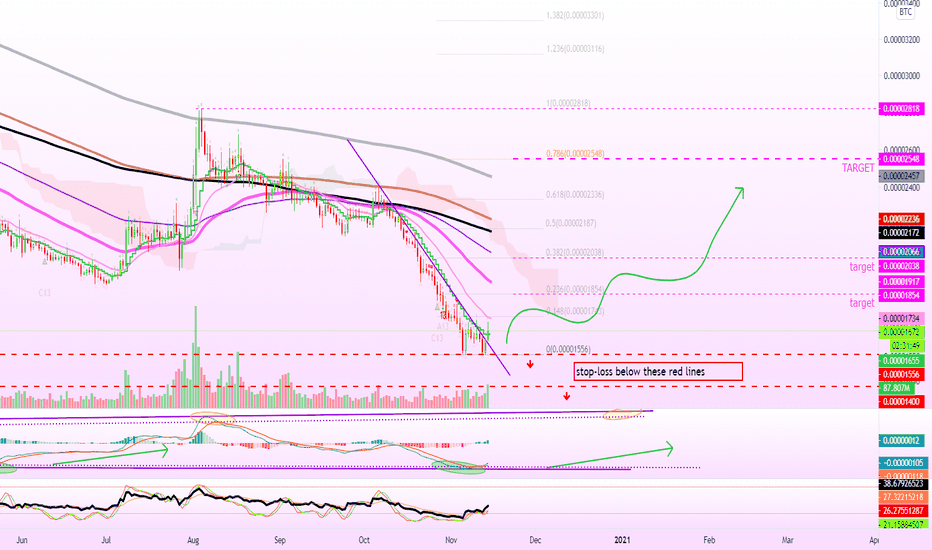
Nov 14. Ripple (XRP) Daily | Volume Starts To Increase (Targets & More)
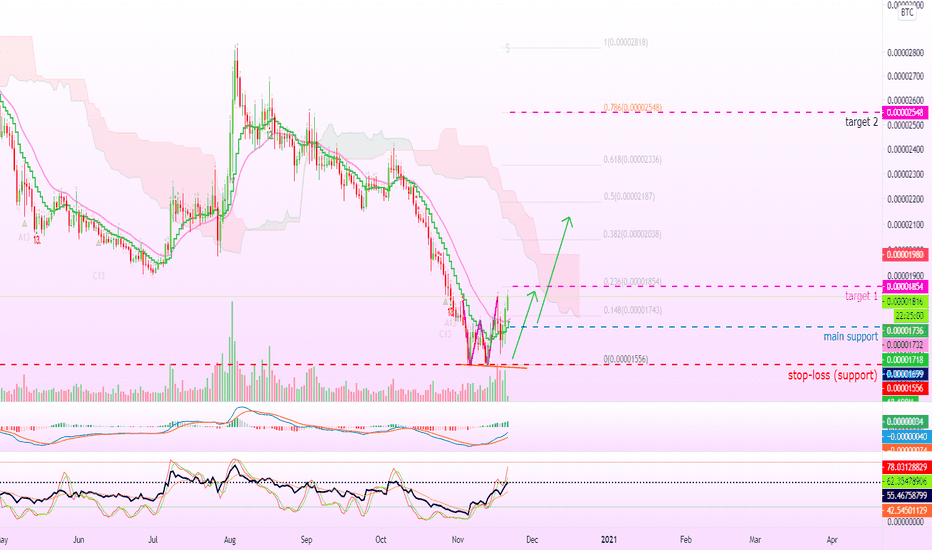
Nov 20. You Already Know About Ripple (XRPBTC) | Final Call!

✅ Cryptocurrencies technical analysis & results
t.me/masteranandatrades/9279
✅ Stocks technical analysis
t.me/anandastocks
✅ Enjoyed the content?
Join PREMIUM channels to show your support!
t.me/lamatrades/4 (since 2017)
t.me/masteranandatrades/9279
✅ Stocks technical analysis
t.me/anandastocks
✅ Enjoyed the content?
Join PREMIUM channels to show your support!
t.me/lamatrades/4 (since 2017)
相关出版物
免责声明
这些信息和出版物并非旨在提供,也不构成TradingView提供或认可的任何形式的财务、投资、交易或其他类型的建议或推荐。请阅读使用条款了解更多信息。
✅ Cryptocurrencies technical analysis & results
t.me/masteranandatrades/9279
✅ Stocks technical analysis
t.me/anandastocks
✅ Enjoyed the content?
Join PREMIUM channels to show your support!
t.me/lamatrades/4 (since 2017)
t.me/masteranandatrades/9279
✅ Stocks technical analysis
t.me/anandastocks
✅ Enjoyed the content?
Join PREMIUM channels to show your support!
t.me/lamatrades/4 (since 2017)
相关出版物
免责声明
这些信息和出版物并非旨在提供,也不构成TradingView提供或认可的任何形式的财务、投资、交易或其他类型的建议或推荐。请阅读使用条款了解更多信息。