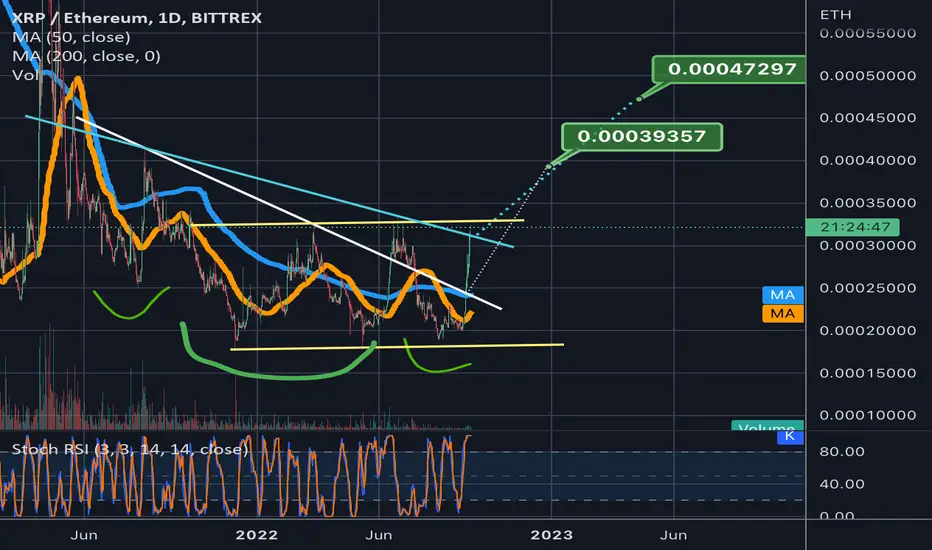
After reaching the breakout target of a much smaller inverse head and shoulder pattern, the price action on the xrpeth chart has continued to pump and is now sitting above 2 necklines of a much bigger inv h&s pattern. The only resistance it is yet to break above is the yellow horizontal neckline of a double bottom pattern that also doubles as a horizontal channel. Flipping that top yellow horizontal line to solidified support will be the final confirmation we need to know that the inv h&s pattern is going to get validated. There are 2 different breakout targets posted here for the inv h&s pattern. The smaller one is for if the white neckline is more valid and the larger target is for is the turquoise neckline is more valid. I get the feeling both targets will be reached in due time. I will post the chart of the previous idea that showed the smaller inv h&s not shown here down below. *not financial advice*
注释
There is a noticeable gap up between yesterdays candle and todays so we may see a retrace to fill that gap before we break above the yellow channel.
免责声明
这些信息和出版物并非旨在提供,也不构成TradingView提供或认可的任何形式的财务、投资、交易或其他类型的建议或推荐。请阅读使用条款了解更多信息。