
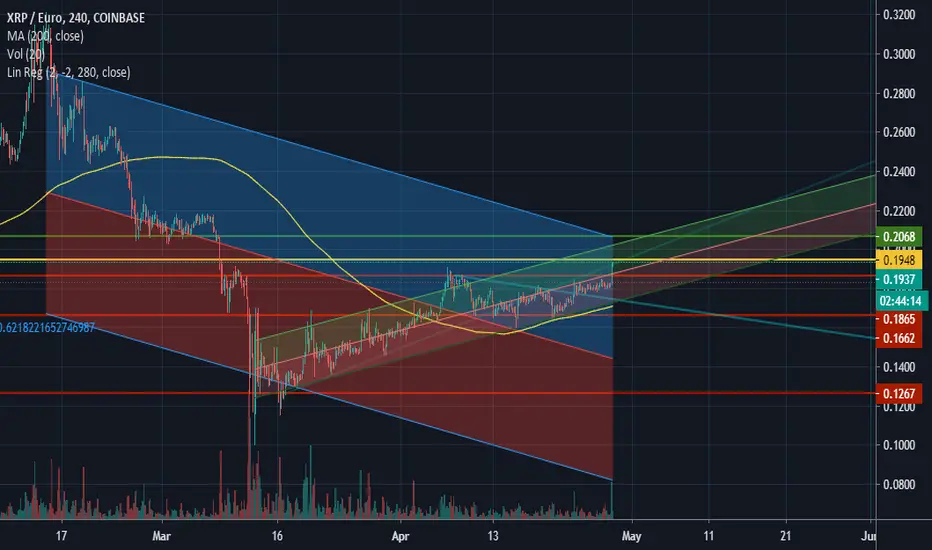
The bullish rally is going to test 24 January 2020 resistance at 0,1948 (YELLOW LINE)
2 possibles scenarios as always:
1st With big volume breaks the resistance level (YELLOW LINE) and test it again for the possible target at 0,2068.
2st bounce back on the resistance looking for sell opportunities.
The price follows the bullish regression trendline 12 march green one.
The regression trendline blue one is for the bigger downtrend 15 february confirms 0,2068 as a possible target for long positions.
Next analysis it will be on XRPUSD.
2 possibles scenarios as always:
1st With big volume breaks the resistance level (YELLOW LINE) and test it again for the possible target at 0,2068.
2st bounce back on the resistance looking for sell opportunities.
The price follows the bullish regression trendline 12 march green one.
The regression trendline blue one is for the bigger downtrend 15 february confirms 0,2068 as a possible target for long positions.
Next analysis it will be on XRPUSD.

免责声明
这些信息和出版物并非旨在提供,也不构成TradingView提供或认可的任何形式的财务、投资、交易或其他类型的建议或推荐。请阅读使用条款了解更多信息。
免责声明
这些信息和出版物并非旨在提供,也不构成TradingView提供或认可的任何形式的财务、投资、交易或其他类型的建议或推荐。请阅读使用条款了解更多信息。