
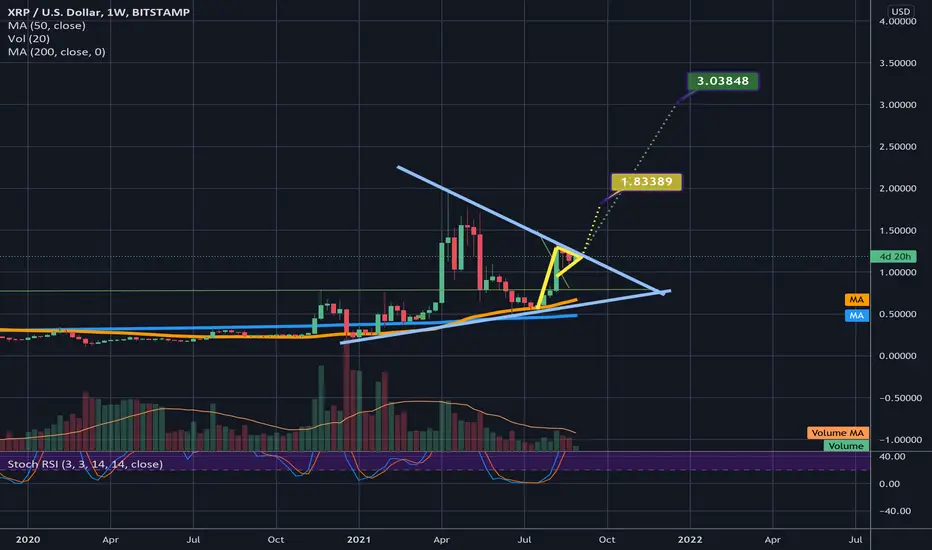
Subject says it all in this one. Although now that it is the weekly time frame you cant see the golden cross ont he daily chart you can still get a clearer view of how the two patterns work together as bullish confluence. If the yellow pennant confirms its bullish breakout, odds are good that the larger light blue symmetrical triangle will as well. *not financial advice*

免责声明
这些信息和出版物并非旨在提供,也不构成TradingView提供或认可的任何形式的财务、投资、交易或其他类型的建议或推荐。请阅读使用条款了解更多信息。
免责声明
这些信息和出版物并非旨在提供,也不构成TradingView提供或认可的任何形式的财务、投资、交易或其他类型的建议或推荐。请阅读使用条款了解更多信息。