
Markets rarely move in straight lines. Most impulses are followed by a repair phase where price compresses and participation cools.
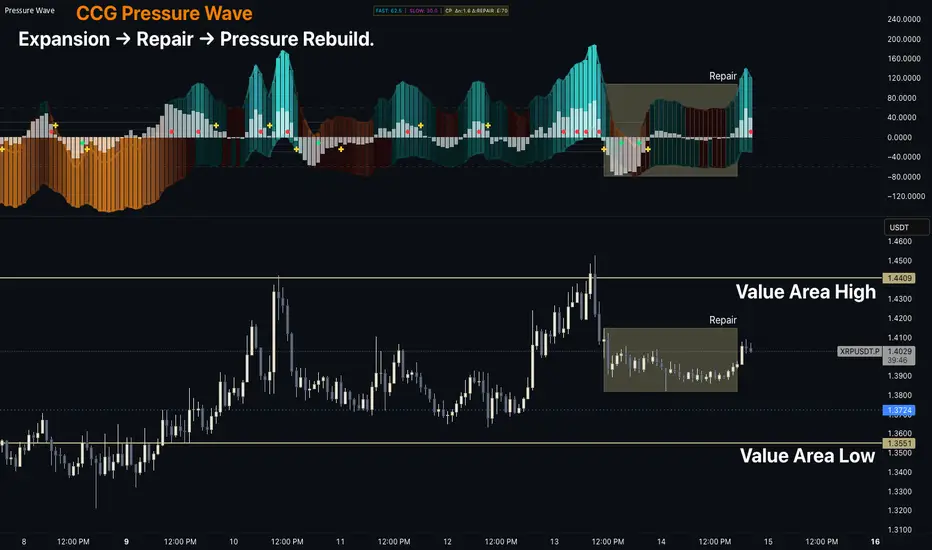
In this example, price enters a range near Value Area High while Pressure Wave shows pressure contracting and flattening — a sign the market is digesting the prior move rather than committing to a new one.
As the range matures, pressure begins rebuilding internally before price attempts to move again. This shift in participation is what Pressure Wave is designed to visualize.
The goal isn’t prediction — it’s clarity.
Seeing when pressure is expanding, repairing, or rebuilding helps traders better understand the current phase of the auction.
In this example, price enters a range near Value Area High while Pressure Wave shows pressure contracting and flattening — a sign the market is digesting the prior move rather than committing to a new one.
As the range matures, pressure begins rebuilding internally before price attempts to move again. This shift in participation is what Pressure Wave is designed to visualize.
The goal isn’t prediction — it’s clarity.
Seeing when pressure is expanding, repairing, or rebuilding helps traders better understand the current phase of the auction.

Confluence Command Group | TradingView tools and chart lessons
ccgtradingllc.com
ccgtradingllc.com
免责声明
这些信息和出版物并非旨在提供,也不构成TradingView提供或认可的任何形式的财务、投资、交易或其他类型的建议或推荐。请阅读使用条款了解更多信息。
Confluence Command Group | TradingView tools and chart lessons
ccgtradingllc.com
ccgtradingllc.com
免责声明
这些信息和出版物并非旨在提供,也不构成TradingView提供或认可的任何形式的财务、投资、交易或其他类型的建议或推荐。请阅读使用条款了解更多信息。