
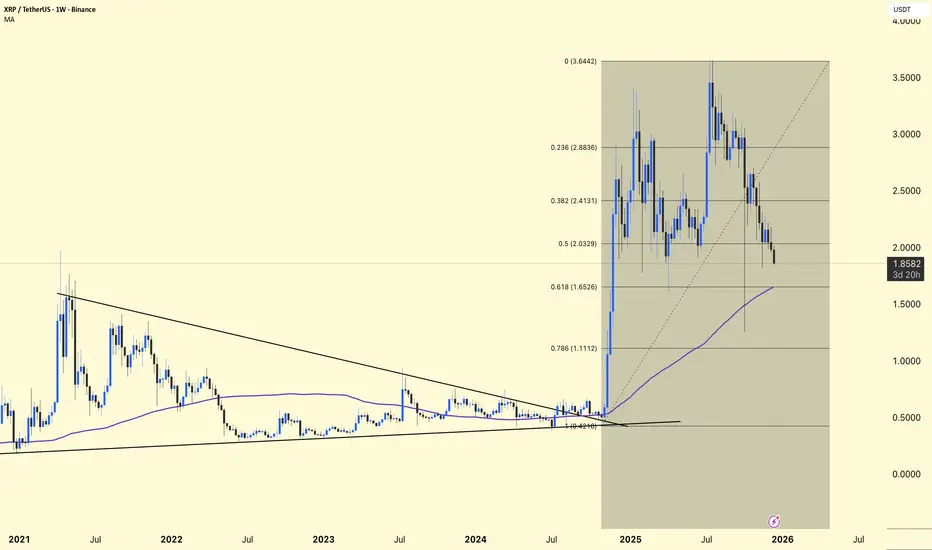
XRP/USDT – Chart Analysis (Weekly)
XRP has broken out of a multi-year downtrend line → confirming a major trend reversal
Strong impulsive rally after prolonged accumulation
The current price action is a healthy corrective pullback, not a bearish reversal
As long as the higher support zones hold, the structure remains bullish.
Fibonacci Analysis.
(Fibonacci drawn from macro low → to recent high)
0.236 – 2.88 → Strong rejection zone (local top)
0.382 – 2.41 → Supply / Resistance
0.5 – 2.03 → Mid-range level
0.618 – 1.65 → Golden Support Zone
0.786 – 1.11 → Strong demand and last bullish defense
The price is currently trading between 0.5 and 0.618, close to a high-probability demand zone.
Moving Average Confirmation
The price is still above the rising weekly MA (~1.65)
The MA is acting as dynamic support
In a bull cycle, the price often dips below the MA and recovers
As long as the weekly closes remain near/above the MA, the bullish trend remains intact.
DYOR | NFA.
XRP has broken out of a multi-year downtrend line → confirming a major trend reversal
Strong impulsive rally after prolonged accumulation
The current price action is a healthy corrective pullback, not a bearish reversal
As long as the higher support zones hold, the structure remains bullish.
Fibonacci Analysis.
(Fibonacci drawn from macro low → to recent high)
0.236 – 2.88 → Strong rejection zone (local top)
0.382 – 2.41 → Supply / Resistance
0.5 – 2.03 → Mid-range level
0.618 – 1.65 → Golden Support Zone
0.786 – 1.11 → Strong demand and last bullish defense
The price is currently trading between 0.5 and 0.618, close to a high-probability demand zone.
Moving Average Confirmation
The price is still above the rising weekly MA (~1.65)
The MA is acting as dynamic support
In a bull cycle, the price often dips below the MA and recovers
As long as the weekly closes remain near/above the MA, the bullish trend remains intact.
DYOR | NFA.

相关出版物
免责声明
这些信息和出版物并非旨在提供,也不构成TradingView提供或认可的任何形式的财务、投资、交易或其他类型的建议或推荐。请阅读使用条款了解更多信息。