
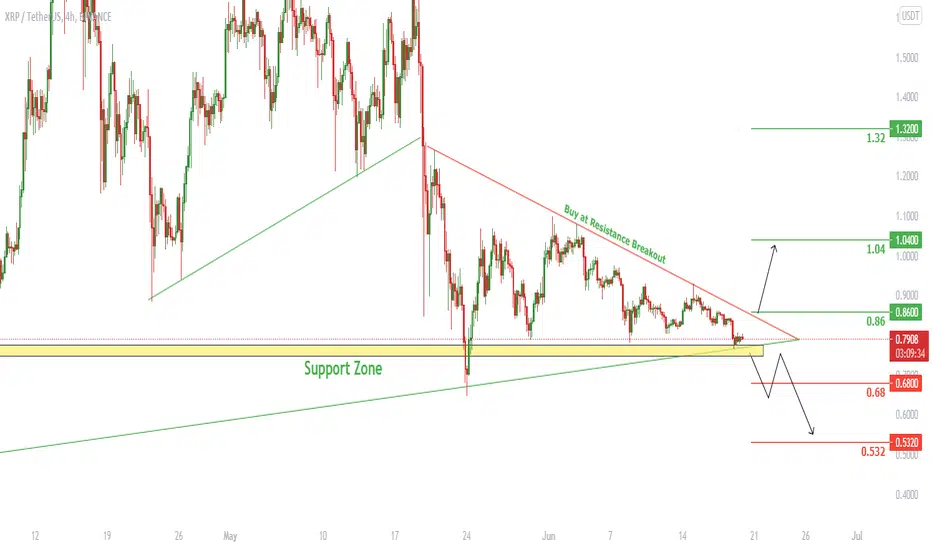
So here on XRPUSDT the price has formed a descending Triangle at the Support zone and has got 3 rejections. It is expected that the prices breaks above the Resistance line and goes higher up to 1.04
If the breakout happened at the lower time frame we need to see the candlestick patterns and if we see a Bullish pattern we can go long.
However if it breaks below the Support then after a Pullback it's expected to go lower down to 0.532
Have a Profitable Day
If you find this helpful and want more FREE forecasts in TradingView
Please show your support back,
Hit the 👍 LIKE button,
Drop some feedback below in the comment!
❤️ Your Support is really appreciated!❤️

免责声明
这些信息和出版物并非旨在提供,也不构成TradingView提供或认可的任何形式的财务、投资、交易或其他类型的建议或推荐。请阅读使用条款了解更多信息。
免责声明
这些信息和出版物并非旨在提供,也不构成TradingView提供或认可的任何形式的财务、投资、交易或其他类型的建议或推荐。请阅读使用条款了解更多信息。