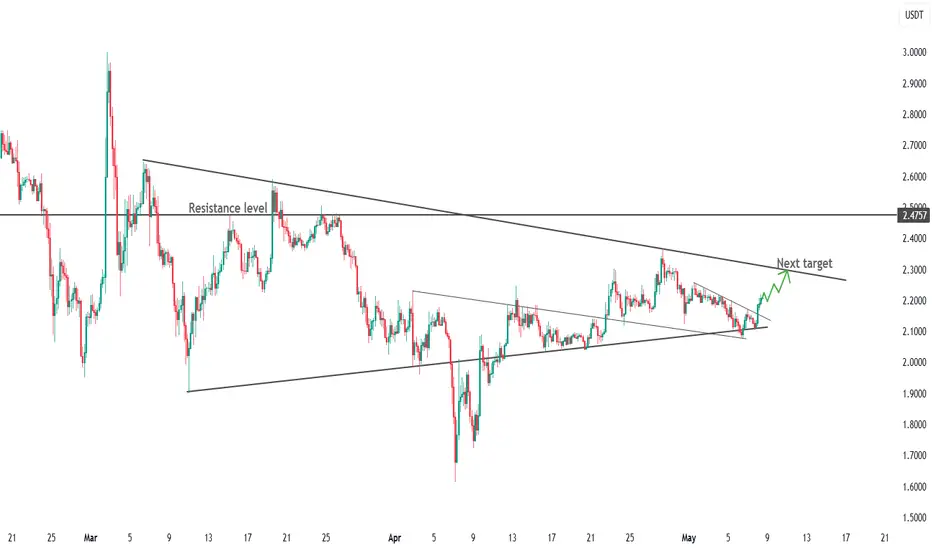
 XRP - bulls attack triangle, focus on 2.30 → 2.48 USDT
Price has been holding above the ascending support since mid-March and has just popped out of a local falling wedge, keeping the chance of a breakout of the main downtrend line alive.
📌 Levels
- S1 2.10 USDT - dynamic support and bottom of the small wedge
- S2 2.00 USDT - round number and bottom of the broad pattern
- R1 2,30 USDT - crossing of the downtrend line (target #1)
- R2 2,48 USDT - horizontal “Resistance level”, potential reversal boundary
📈 Scenario
A consolidation above 2.30 will confirm the bullish exit from the triangle and open the way to 2.48 USDT. A breakout to 2.60 is possible if volume strengthens.
⚠️ Risks
A failure below 2.10 will bring the price back to the narrowing range; a move below 2.00 will increase sellers' pressure and target 1.90-1.85 USDT.

免责声明
这些信息和出版物并非旨在提供,也不构成TradingView提供或认可的任何形式的财务、投资、交易或其他类型的建议或推荐。请阅读使用条款了解更多信息。
免责声明
这些信息和出版物并非旨在提供,也不构成TradingView提供或认可的任何形式的财务、投资、交易或其他类型的建议或推荐。请阅读使用条款了解更多信息。