XTI/USD Chart Analysis: Oil Price Volatility on the Rise
XTI/USD Chart Analysis: Oil Price Volatility on the Rise
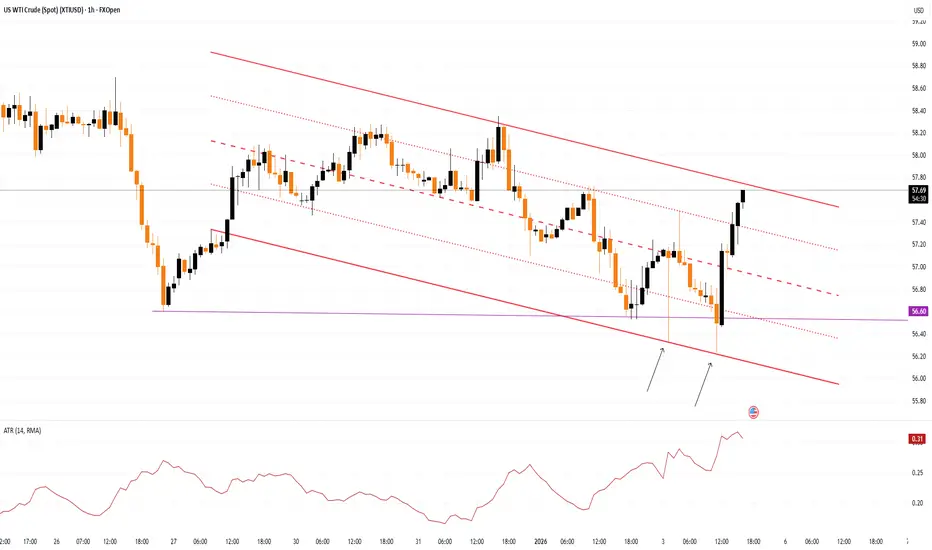
Events in Venezuela over the weekend have led to a sharp increase in oil price volatility following the market open. As the chart shows, during the European session the ATR indicator rose to levels last seen before the start of the Christmas period.
It is possible that the opening of US trading could further increase price swings, with the trend potentially developing in either direction:
- Bearish scenario: if American companies gain access to Venezuela’s oil reserves (both in the ground and in storage facilities), this could lead to an increase in supply on the global market.
- Bullish scenario: risks include reactions from China, OPEC+, as well as the possibility of a guerrilla warfare scenario and other difficult-to-predict developments.

At present, WTI crude oil price is holding near the median of the descending channel (highlighted in red). Note the long lower wicks forming when the price touches the lower boundary of the channel, indicating a sharp activation of demand whenever the price falls below the 26 December low of around $56.60 per barrel.
This behaviour resembles a bear trap and could trigger a bullish impulse, potentially testing the upper boundary of the channel.
This article represents the opinion of the Companies operating under the FXOpen brand only. It is not to be construed as an offer, solicitation, or recommendation with respect to products and services provided by the Companies operating under the FXOpen brand, nor is it to be considered financial advice.
Events in Venezuela over the weekend have led to a sharp increase in oil price volatility following the market open. As the chart shows, during the European session the ATR indicator rose to levels last seen before the start of the Christmas period.
It is possible that the opening of US trading could further increase price swings, with the trend potentially developing in either direction:
- Bearish scenario: if American companies gain access to Venezuela’s oil reserves (both in the ground and in storage facilities), this could lead to an increase in supply on the global market.
- Bullish scenario: risks include reactions from China, OPEC+, as well as the possibility of a guerrilla warfare scenario and other difficult-to-predict developments.
At present, WTI crude oil price is holding near the median of the descending channel (highlighted in red). Note the long lower wicks forming when the price touches the lower boundary of the channel, indicating a sharp activation of demand whenever the price falls below the 26 December low of around $56.60 per barrel.
This behaviour resembles a bear trap and could trigger a bullish impulse, potentially testing the upper boundary of the channel.
This article represents the opinion of the Companies operating under the FXOpen brand only. It is not to be construed as an offer, solicitation, or recommendation with respect to products and services provided by the Companies operating under the FXOpen brand, nor is it to be considered financial advice.

免责声明
这些信息和出版物并非旨在提供,也不构成TradingView提供或认可的任何形式的财务、投资、交易或其他类型的建议或推荐。请阅读使用条款了解更多信息。