做多
✳️ Tezos Candlestick Pattern Confirms Bottom (500% Or More)
Join me, let's start with candlestick reading.
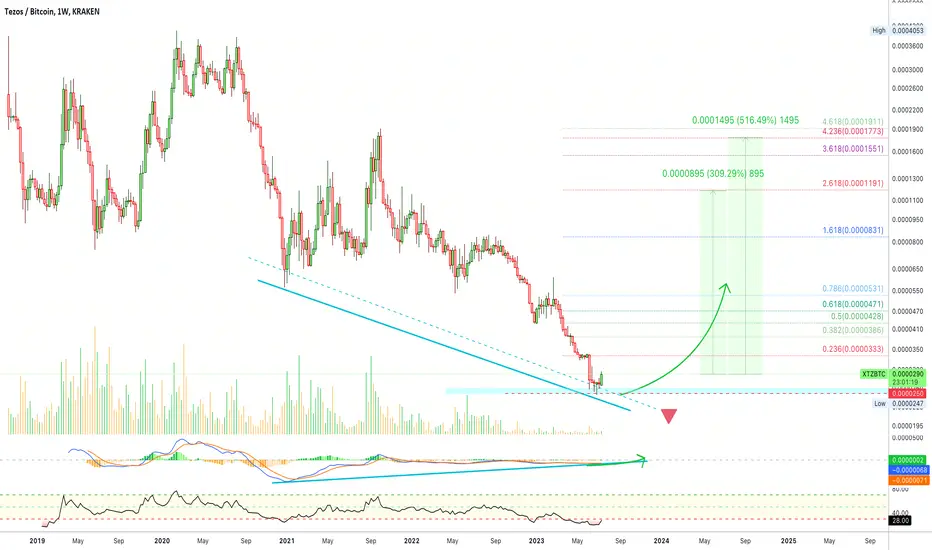
Tezos (XTZBTC) Weekly Chart

We have two candles to look at in this chart.
1) Following a strong drop, high bear volume, we get a Hammer (26-June). It produces a lower low compared to early June but the volume is lower and the candlestick closes green. All this combined can be read as a reversal signal.
2) This week we have a full green candle with the highest volume since February and trading above the four previous candles high/close. This candle confirms the reversal signal we got from the hammer.
That's it.
You can also see a young bullish cross on the MACD, with bullish divergence on the histogram turned green:
And the RSI hitting a new All-Time Low.
I don't know if Tezos will increase in price but the chart is saying up.
The potential can vary... Medium-term 300%, long-term much more.
Additional details on the chart.
Namaste.
Tezos (XTZBTC) Weekly Chart
We have two candles to look at in this chart.
1) Following a strong drop, high bear volume, we get a Hammer (26-June). It produces a lower low compared to early June but the volume is lower and the candlestick closes green. All this combined can be read as a reversal signal.
2) This week we have a full green candle with the highest volume since February and trading above the four previous candles high/close. This candle confirms the reversal signal we got from the hammer.
That's it.
You can also see a young bullish cross on the MACD, with bullish divergence on the histogram turned green:
And the RSI hitting a new All-Time Low.
I don't know if Tezos will increase in price but the chart is saying up.
The potential can vary... Medium-term 300%, long-term much more.
Additional details on the chart.
Namaste.

Trading Cryptocurrencies can be the hardest undertaking ever without the right trade-numbers, without accurate private-access information. Free is free, but the best always requires sweat, an investment. Since 2017 👇
t.me/masteranandatrades/8778
t.me/masteranandatrades/8778
相关出版物
免责声明
这些信息和出版物并非旨在提供,也不构成TradingView提供或认可的任何形式的财务、投资、交易或其他类型的建议或推荐。请阅读使用条款了解更多信息。
Trading Cryptocurrencies can be the hardest undertaking ever without the right trade-numbers, without accurate private-access information. Free is free, but the best always requires sweat, an investment. Since 2017 👇
t.me/masteranandatrades/8778
t.me/masteranandatrades/8778
相关出版物
免责声明
这些信息和出版物并非旨在提供,也不构成TradingView提供或认可的任何形式的财务、投资、交易或其他类型的建议或推荐。请阅读使用条款了解更多信息。