做空
Using Moving Averages, and Fibonacci retracements and extensions
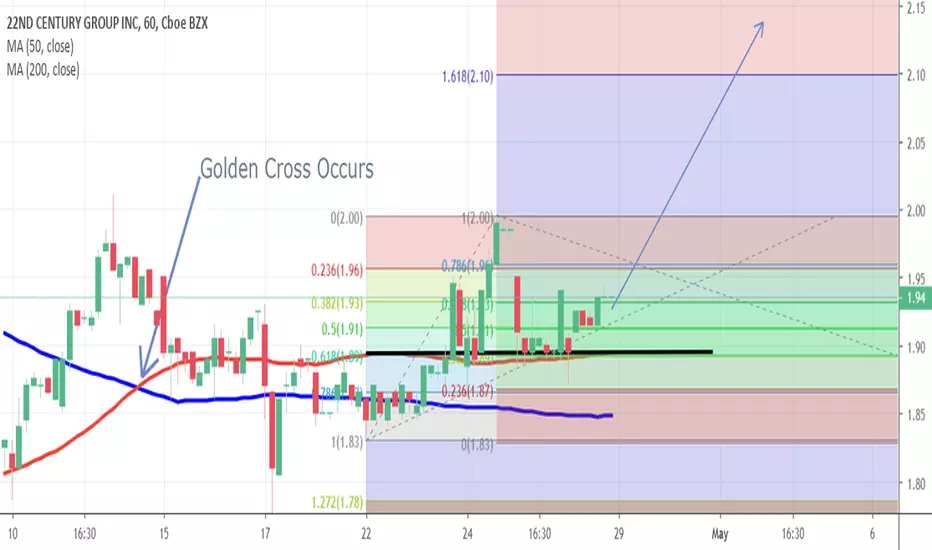
- As seen on the left side of the chart, the HOLY golden cross occurred which shows a very bullish move
- The 50 day moving average continues to be above the 200 day moving average (VERY GOOD SIGN)
- As seen using the fibonacci retracement tool, there is strong support at the $1.89 marker
- This pattern should lead to a strong uptrend and our Target 1 should be at the $2.10
- The 50 day moving average continues to be above the 200 day moving average (VERY GOOD SIGN)
- As seen using the fibonacci retracement tool, there is strong support at the $1.89 marker
- This pattern should lead to a strong uptrend and our Target 1 should be at the $2.10
注释
This projection was spot on!! Hope this stock can make it to the $2.10 mark!
免责声明
这些信息和出版物并非旨在提供,也不构成TradingView提供或认可的任何形式的财务、投资、交易或其他类型的建议或推荐。请阅读使用条款了解更多信息。
免责声明
这些信息和出版物并非旨在提供,也不构成TradingView提供或认可的任何形式的财务、投资、交易或其他类型的建议或推荐。请阅读使用条款了解更多信息。