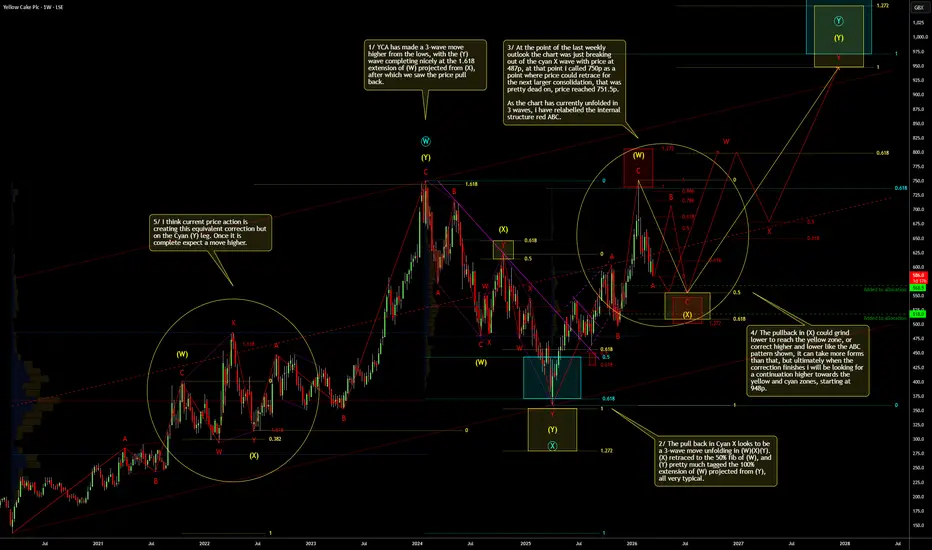
Here is the updated Weekly outlook on  YCA .
YCA .
At the point of the last weekly outlook the chart was just breaking out of the cyan X wave with price at 487p, at that point i called 750p as a point where price could retrace for the next larger consolidation, that was pretty dead on, price reached 751.5p.
The pullback in (X) could grind lower to reach the yellow zone, or correct higher and lower like the ABC pattern shown, it can take more forms than that, but ultimately when the correction finishes i will be looking for a continuation higher towards the yellow and cyan zones, starting at 948p.
Note: i create my outlooks with the browser tabs hidden (F11) so if they look squashed, that is why.
If you appreciate my analysis, i'd appreciate a like and follow.
YCA .At the point of the last weekly outlook the chart was just breaking out of the cyan X wave with price at 487p, at that point i called 750p as a point where price could retrace for the next larger consolidation, that was pretty dead on, price reached 751.5p.
The pullback in (X) could grind lower to reach the yellow zone, or correct higher and lower like the ABC pattern shown, it can take more forms than that, but ultimately when the correction finishes i will be looking for a continuation higher towards the yellow and cyan zones, starting at 948p.
Note: i create my outlooks with the browser tabs hidden (F11) so if they look squashed, that is why.
If you appreciate my analysis, i'd appreciate a like and follow.

免责声明
这些信息和出版物并非旨在提供,也不构成TradingView提供或认可的任何形式的财务、投资、交易或其他类型的建议或推荐。请阅读使用条款了解更多信息。