
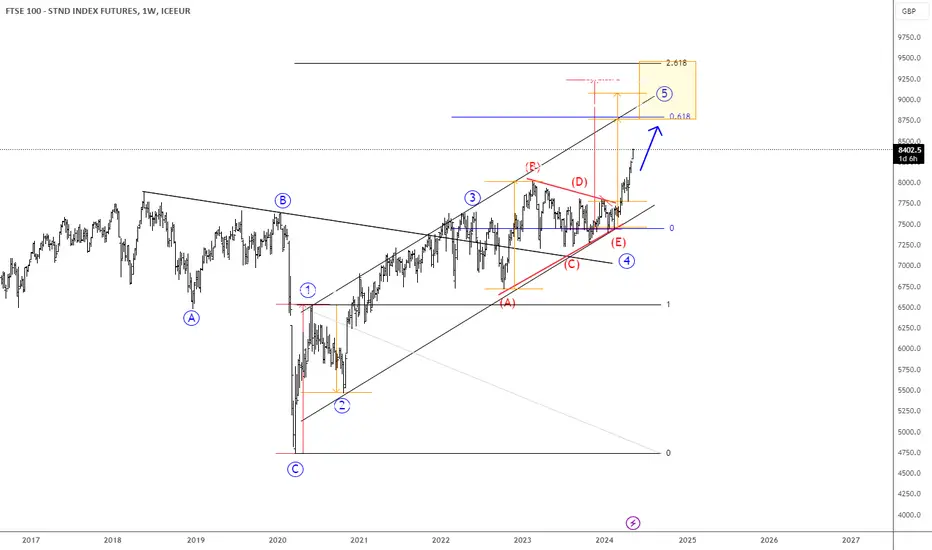
We have been talking for a long time about bullish UK stock market index FTSE100 a.k.a. Footsie. We also shared the chart with our members more than a year ago, where we were tracking wave 4 correction within an ongoing five-wave bullish impulse.
After a longer sideways consolidation, it turned out to be a bullish triangle pattern in wave 4, but as you can see, it’s now finally and nicely extending higher for wave 5 as expected. There can be space even up to 8800 – 9400 target area, just watch out on short-term pullbacks.
After a longer sideways consolidation, it turned out to be a bullish triangle pattern in wave 4, but as you can see, it’s now finally and nicely extending higher for wave 5 as expected. There can be space even up to 8800 – 9400 target area, just watch out on short-term pullbacks.

Join the community and get access to our analysis >> @ wavetraders.com/
Learn Elliott Waves Sale-65%
👉 wavetraders.com/academy/
Newsletter
👉 bit.ly/3FVPVzO
Learn Elliott Waves Sale-65%
👉 wavetraders.com/academy/
Newsletter
👉 bit.ly/3FVPVzO
相关出版物
免责声明
这些信息和出版物并非旨在提供,也不构成TradingView提供或认可的任何形式的财务、投资、交易或其他类型的建议或推荐。请阅读使用条款了解更多信息。
Join the community and get access to our analysis >> @ wavetraders.com/
Learn Elliott Waves Sale-65%
👉 wavetraders.com/academy/
Newsletter
👉 bit.ly/3FVPVzO
Learn Elliott Waves Sale-65%
👉 wavetraders.com/academy/
Newsletter
👉 bit.ly/3FVPVzO
相关出版物
免责声明
这些信息和出版物并非旨在提供,也不构成TradingView提供或认可的任何形式的财务、投资、交易或其他类型的建议或推荐。请阅读使用条款了解更多信息。