
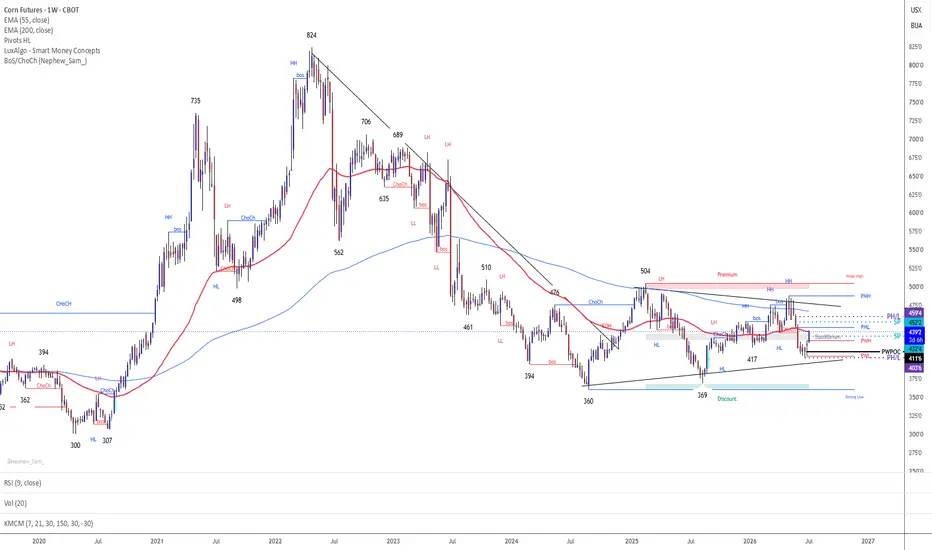
The reason why i am getting interested with the Grains is : Fertilizers have double in price and the majors producers GCC countries ships are still not going through Hormuz...coming September harvesting figures could produce a surprise...and technically speaking ...just look at the chart .
DXY & REAL YIELD IMPLICATIONS
DXY 100.93, real yield 2.255% — mid-range, no directional extreme. Dollar softness would be constructive for BCOM broadly (125.62) and export competitiveness; a hawkish minutes surprise lifts both DXY and real yields, pressuring grain complex via macro correlation even against a firm crop-condition backdrop. Watch DXY/real-yield reaction Wed as the dominant cross-asset filter into WASDE Friday. LIQUIDITY MAP : TPO: Single prints 432.4/452.2 — price currently sits between; 432.4 becomes first support/inefficiency to revisit on pullback, 452.2 is the next upside magnet/resistance shelf. Poor High/Low 403.6/459.4 — both unresolved, longer-dated liquidity pools; 459.4 poor high is the higher-timeframe draw if breakout sustains. Weekly POC 437.6 sits just under spot — value area migrating up, POC now first line of defense on any retracement. Prior Weekly POC 411.6 is stale/left behind — confirms upward value migration. WYCKOFF / MARKET PROFILE
Structure resembles a Spring/test sequence off the 403.6–406.2 low cluster (poor low + weekly low confluence), now in markup phase testing the weekly 55 EMA and migrating POC. Volume/velocity divergence (see KMCM below) suggests the current push is running hot relative to the daily balance — classic early-markup vs. UTAD risk if 452.2 rejects on declining effort-to-result. USDA Crop Progress — released Monday, July 6, 2026 (as of Sunday, July 5)
Corn:
Good/Excellent: 67%, steady w/w
Silking: 16% (behind average pace)
Dough stage: 3%
Weather flag: wide-ranging week — heat + flooding in parts of the Belt, full impact may not show until next week's read given survey cutoff timing YoY context: this week last year corn was rated 74% G/E (steady-to-improving into July). Current 67% is a 7-point YoY deficit — meaningfully behind last year's pace despite this year's rating holding flat rather than declining. That gap is the more price-relevant data point than the flat w/w print itself: tighter crop-quality trajectory into pod/dough-fill season is a incremental bullish input for the WASDE July 10 yield assumption, especially if the flood/heat stress flagged this week shows up as a downgrade in next Monday's report. TRADE LOCATION & INVALIDATION
Long continuation:
Entry zone: 437.6 (POC) – 432.4 (single print) on retracement
Target 1: 449.2 (monthly high) | Target 2: 452.2 (single print) | Stretch: 459.4 (poor high)
Invalidation: close back below 427.0 (weekly high, now support) — structure failure
Fade/short (tactical, counter-trend):
Entry: 449.2–452.2 resistance confluence
Target: 440.0 → 437.6 POC
Invalidation: sustained close above 452.2 Net skew constructive: BOS confirmed on daily/weekly, Managed Money covering shorts, 6M COT elevated but 36M neutral (no extreme to fade). Primary risk is the daily/4H KMCM divergence — don't chase strength above 449–452 without a POC retest first.
DXY & REAL YIELD IMPLICATIONS
DXY 100.93, real yield 2.255% — mid-range, no directional extreme. Dollar softness would be constructive for BCOM broadly (125.62) and export competitiveness; a hawkish minutes surprise lifts both DXY and real yields, pressuring grain complex via macro correlation even against a firm crop-condition backdrop. Watch DXY/real-yield reaction Wed as the dominant cross-asset filter into WASDE Friday. LIQUIDITY MAP : TPO: Single prints 432.4/452.2 — price currently sits between; 432.4 becomes first support/inefficiency to revisit on pullback, 452.2 is the next upside magnet/resistance shelf. Poor High/Low 403.6/459.4 — both unresolved, longer-dated liquidity pools; 459.4 poor high is the higher-timeframe draw if breakout sustains. Weekly POC 437.6 sits just under spot — value area migrating up, POC now first line of defense on any retracement. Prior Weekly POC 411.6 is stale/left behind — confirms upward value migration. WYCKOFF / MARKET PROFILE
Structure resembles a Spring/test sequence off the 403.6–406.2 low cluster (poor low + weekly low confluence), now in markup phase testing the weekly 55 EMA and migrating POC. Volume/velocity divergence (see KMCM below) suggests the current push is running hot relative to the daily balance — classic early-markup vs. UTAD risk if 452.2 rejects on declining effort-to-result. USDA Crop Progress — released Monday, July 6, 2026 (as of Sunday, July 5)
Corn:
Good/Excellent: 67%, steady w/w
Silking: 16% (behind average pace)
Dough stage: 3%
Weather flag: wide-ranging week — heat + flooding in parts of the Belt, full impact may not show until next week's read given survey cutoff timing YoY context: this week last year corn was rated 74% G/E (steady-to-improving into July). Current 67% is a 7-point YoY deficit — meaningfully behind last year's pace despite this year's rating holding flat rather than declining. That gap is the more price-relevant data point than the flat w/w print itself: tighter crop-quality trajectory into pod/dough-fill season is a incremental bullish input for the WASDE July 10 yield assumption, especially if the flood/heat stress flagged this week shows up as a downgrade in next Monday's report. TRADE LOCATION & INVALIDATION
Long continuation:
Entry zone: 437.6 (POC) – 432.4 (single print) on retracement
Target 1: 449.2 (monthly high) | Target 2: 452.2 (single print) | Stretch: 459.4 (poor high)
Invalidation: close back below 427.0 (weekly high, now support) — structure failure
Fade/short (tactical, counter-trend):
Entry: 449.2–452.2 resistance confluence
Target: 440.0 → 437.6 POC
Invalidation: sustained close above 452.2 Net skew constructive: BOS confirmed on daily/weekly, Managed Money covering shorts, 6M COT elevated but 36M neutral (no extreme to fade). Primary risk is the daily/4H KMCM divergence — don't chase strength above 449–452 without a POC retest first.

免责声明
这些信息和出版物并非旨在提供,也不构成TradingView提供或认可的任何形式的财务、投资、交易或其他类型的建议或推荐。请阅读使用条款了解更多信息。
免责声明
这些信息和出版物并非旨在提供,也不构成TradingView提供或认可的任何形式的财务、投资、交易或其他类型的建议或推荐。请阅读使用条款了解更多信息。