
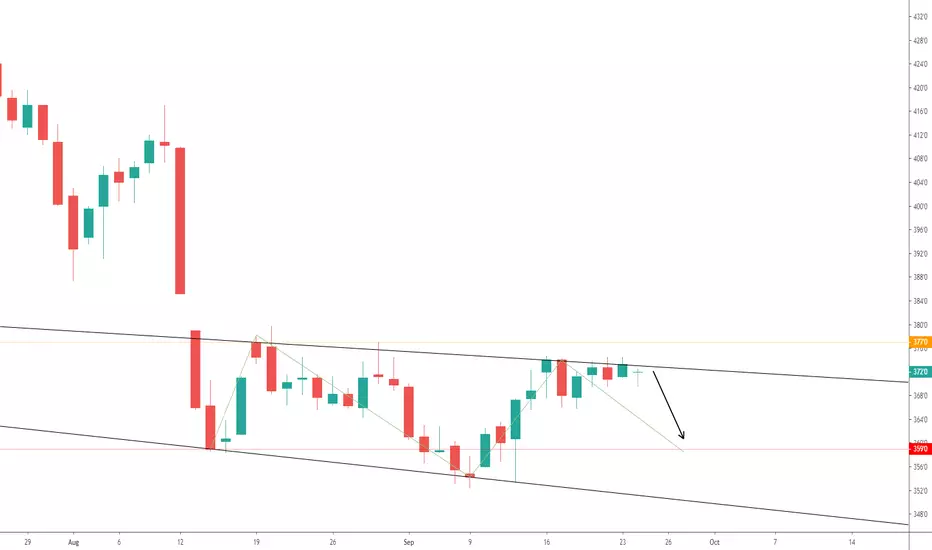
M pattern
Looking at our daily continuous corn contract we will first use our indicators such as RSI, Stoch RSI, and
MACD to determine possible directional position.
Or RSI is heading down the slightest but has been at this high level three major times with no success to
break through and has gone flat. Our Stoch RSI shows slight less buying pressure with the buy RSI above the sell
RSI, therefore still showing slight, not strong but still bullish presence.
Our MACD shows overbought conditions with our buy and sell looking to cross for selling pressure.
(Only 1 real bearish signs with a reasonable half bullish indicator.)
A 10R chart will show a more favorable move to the downside which will break it through the latest low.
an upside move using this technique is unlikely due to previous candle strength after Sep 17 drop.
We are in lower lows and lower highs pattern and are testing the third resistance touch with little strength
to break out.
Looking at our daily continuous corn contract we will first use our indicators such as RSI, Stoch RSI, and
MACD to determine possible directional position.
Or RSI is heading down the slightest but has been at this high level three major times with no success to
break through and has gone flat. Our Stoch RSI shows slight less buying pressure with the buy RSI above the sell
RSI, therefore still showing slight, not strong but still bullish presence.
Our MACD shows overbought conditions with our buy and sell looking to cross for selling pressure.
(Only 1 real bearish signs with a reasonable half bullish indicator.)
A 10R chart will show a more favorable move to the downside which will break it through the latest low.
an upside move using this technique is unlikely due to previous candle strength after Sep 17 drop.
We are in lower lows and lower highs pattern and are testing the third resistance touch with little strength
to break out.

免责声明
这些信息和出版物并非旨在提供,也不构成TradingView提供或认可的任何形式的财务、投资、交易或其他类型的建议或推荐。请阅读使用条款了解更多信息。
免责声明
这些信息和出版物并非旨在提供,也不构成TradingView提供或认可的任何形式的财务、投资、交易或其他类型的建议或推荐。请阅读使用条款了解更多信息。