
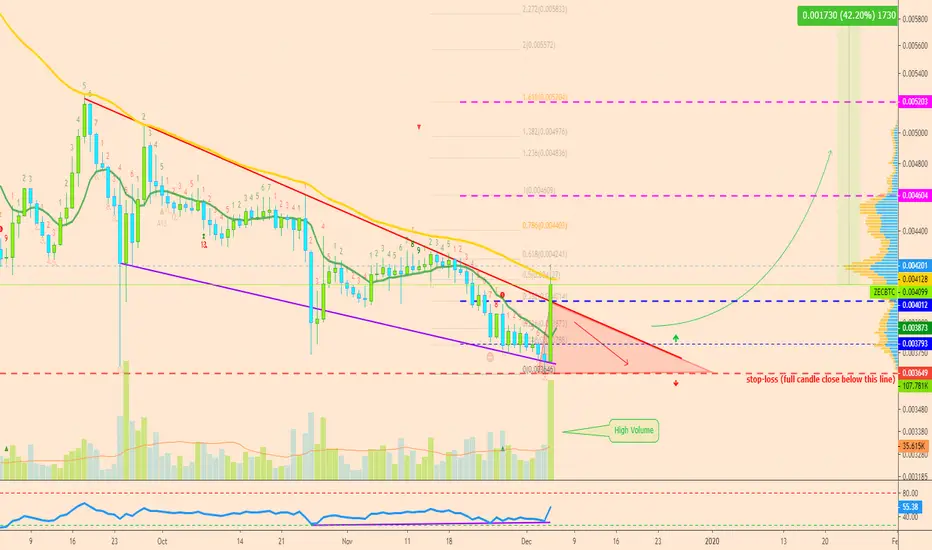
The Zcash (ZECBTC) chart is now printing a very strong bullish candlestick to break above EMA10.
We are seeing good volume coming in after a new low was hit yesterday.
I can see that bullish divergence is showing with the RSI and yesterday's candlestick was a Doji.
Additional details, including targets, can be found on the chart.
Feel free to hit LIKE to show your support.
Thanks a lot for reading.
Namaste.
We are seeing good volume coming in after a new low was hit yesterday.
I can see that bullish divergence is showing with the RSI and yesterday's candlestick was a Doji.
Additional details, including targets, can be found on the chart.
Feel free to hit LIKE to show your support.
Thanks a lot for reading.
Namaste.
注释
New chart for Zcash (ZECBTC)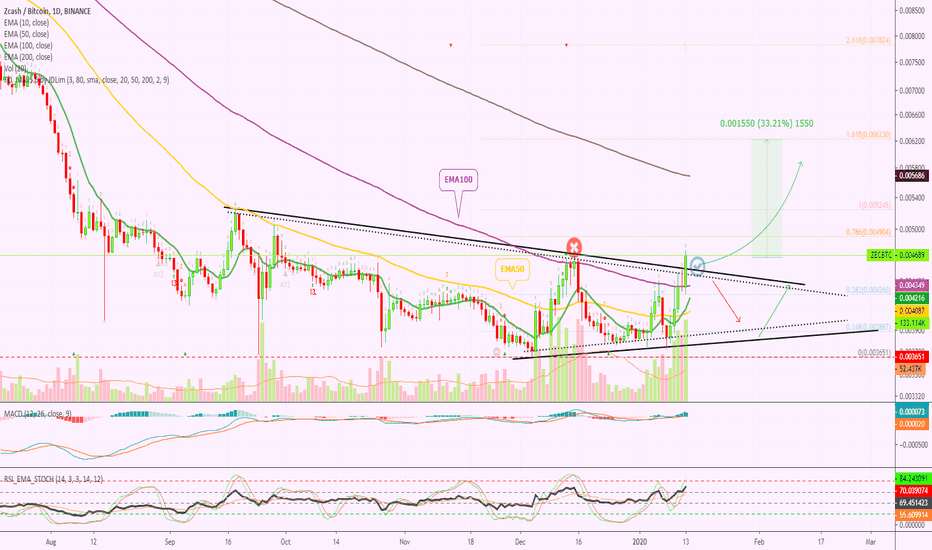

Trading Cryptocurrencies can be the hardest undertaking ever without the right trade-numbers, without accurate private-access information. Free is free, but the best always requires sweat, an investment. Since 2017 👇
t.me/masteranandatrades/8778
t.me/masteranandatrades/8778
相关出版物
免责声明
这些信息和出版物并非旨在提供,也不构成TradingView提供或认可的任何形式的财务、投资、交易或其他类型的建议或推荐。请阅读使用条款了解更多信息。
Trading Cryptocurrencies can be the hardest undertaking ever without the right trade-numbers, without accurate private-access information. Free is free, but the best always requires sweat, an investment. Since 2017 👇
t.me/masteranandatrades/8778
t.me/masteranandatrades/8778
相关出版物
免责声明
这些信息和出版物并非旨在提供,也不构成TradingView提供或认可的任何形式的财务、投资、交易或其他类型的建议或推荐。请阅读使用条款了解更多信息。