
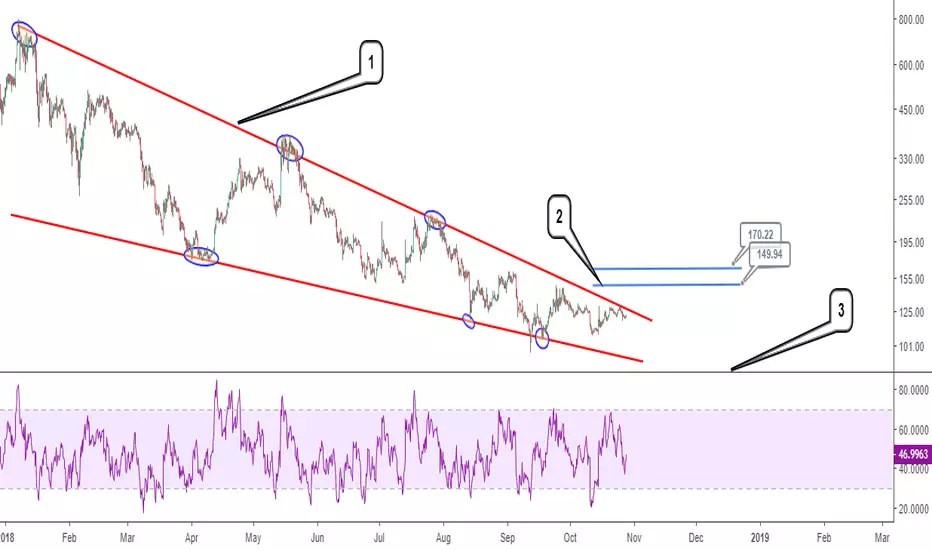
The 6 hour time frame of Zcash is shown in this analysis on a logarithmic scale with commentary provided based on the numbers marked on the chart.
(1) A falling wedge chart pattern is used to capture the entirety of price action from January 10, 2018 till date. The implication of the pattern is ideally bullish and suggests demand for Zcash eventually overwhelming supply.
(2) Immediate region of supply (resistance) that lies above the falling wedge. Range for this region is between ~$170.22 and $149.94. Price action closing to the upside of the almost 9 months old chart pattern, and especially above $170.22 does present a bullish bias in Zcash
(3) The relative strength index (RSI) shown here does negate immediate resumption of bullish momentum, and patience is therefore required.
(1) A falling wedge chart pattern is used to capture the entirety of price action from January 10, 2018 till date. The implication of the pattern is ideally bullish and suggests demand for Zcash eventually overwhelming supply.
(2) Immediate region of supply (resistance) that lies above the falling wedge. Range for this region is between ~$170.22 and $149.94. Price action closing to the upside of the almost 9 months old chart pattern, and especially above $170.22 does present a bullish bias in Zcash
(3) The relative strength index (RSI) shown here does negate immediate resumption of bullish momentum, and patience is therefore required.

相关出版物
免责声明
这些信息和出版物并非旨在提供,也不构成TradingView提供或认可的任何形式的财务、投资、交易或其他类型的建议或推荐。请阅读使用条款了解更多信息。