
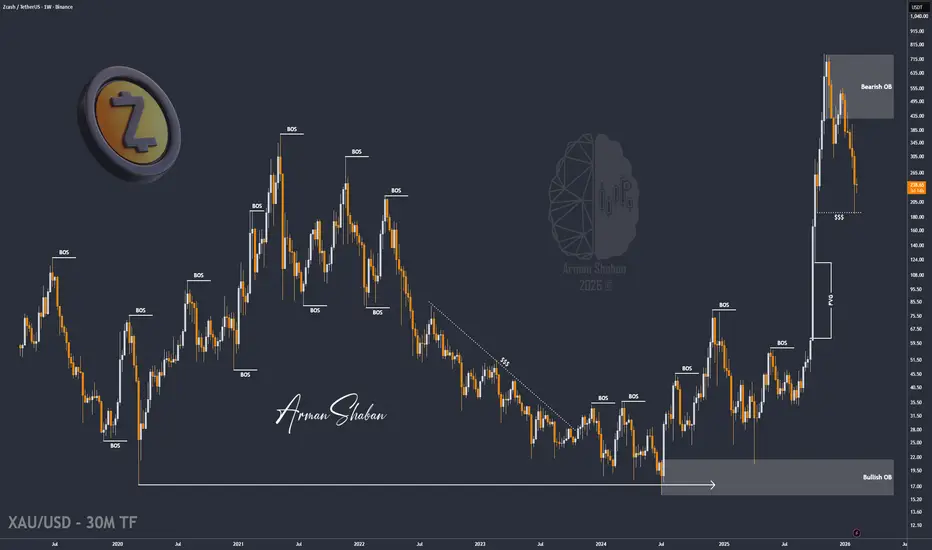
By analyzing the #Zcash chart on the weekly timeframe, we can see that after the massive 3500% rally last year from $20 to $750, price entered a strong corrective phase and recently dropped as low as $186. Right now, demand is stepping back in and ZEC is trading around $237. If price manages to stabilize and hold above the $250 level, we can expect another bullish wave toward higher levels, with potential upside targets at $270, $303, and $360. This analysis will be updated as price continues to react to key levels.
Please support me with your likes and comments to motivate me to share more analysis with you and share your opinion about the possible trend of this chart with me !
Best Regards , Arman Shaban
Please support me with your likes and comments to motivate me to share more analysis with you and share your opinion about the possible trend of this chart with me !
Best Regards , Arman Shaban
交易开始
By analyzing the #Zcash chart on the weekly timeframe, we can see that price is still trading within the $230 to $240 range and has not yet initiated its next major move. After the previous corrective decline, ZEC remains in a consolidation and accumulation phase, showing that the market is building structure before its next expansion.All major assumptions of the previous analysis remain valid. The strong historical rally structure, the confirmed reaction from the $186 low, and the importance of the $250 stabilization level are still the key technical factors driving the outlook. As long as price holds above the broader demand structure and eventually manages to stabilize above $250, the probability of another bullish wave toward higher levels remains intact.
The potential mid-term upside targets of $270, $303, and $360 are still technically valid, but confirmation through breakout and sustained momentum is required.
交易结束:到达目标

📘 Wanna Learn ICT & SMC? Get the Full Book Here : bit.ly/ICT-BOOK
⚜️ Free Telegram Channel : t.me/PriceAction_ICT
⚜️ JOIN THE VIP 👉 t.me/ArmanShabanTrading
🤝 Up to 660 USDT as Rewards : bit.ly/WEEX-Promo
⚜️ Free Telegram Channel : t.me/PriceAction_ICT
⚜️ JOIN THE VIP 👉 t.me/ArmanShabanTrading
🤝 Up to 660 USDT as Rewards : bit.ly/WEEX-Promo
相关出版物
免责声明
这些信息和出版物并非旨在提供,也不构成TradingView提供或认可的任何形式的财务、投资、交易或其他类型的建议或推荐。请阅读使用条款了解更多信息。