
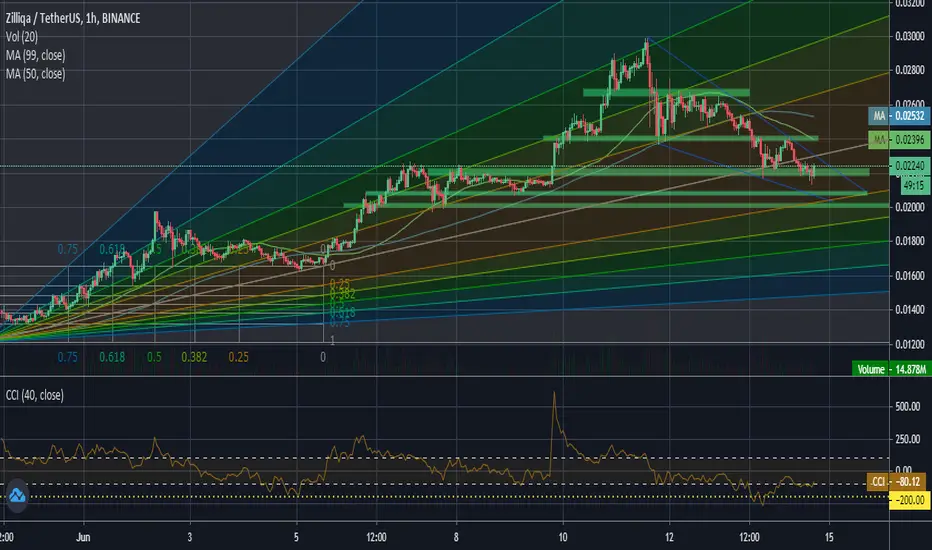
Now we can see testing a support about price 0,022$. When this support will be dismissed, then wil going to next low support on price 0,021$ or 0,02$. When support on price 0,022$ will be passed, we can see attack on price 0,027$ or 0,03$.
Middle channel is possible long trend. This is Fib resistance chart.
Middle channel is possible long trend. This is Fib resistance chart.
注释
We see triangle in 3 min graph. We can move up for testing 0,0265$ - 0,027$ and next move upon to 0,03$. When this triangle will be broken, we can going down on price 0,022$.交易结束:到达目标

免责声明
这些信息和出版物并非旨在提供,也不构成TradingView提供或认可的任何形式的财务、投资、交易或其他类型的建议或推荐。请阅读使用条款了解更多信息。
免责声明
这些信息和出版物并非旨在提供,也不构成TradingView提供或认可的任何形式的财务、投资、交易或其他类型的建议或推荐。请阅读使用条款了解更多信息。