
Back in December 2020, we noticed a global "Head and Shoulders" reversal pattern on the ZK International Group Co., Ltd stock chart and began publishing a series of ideas with reviews of how this pattern worked out.
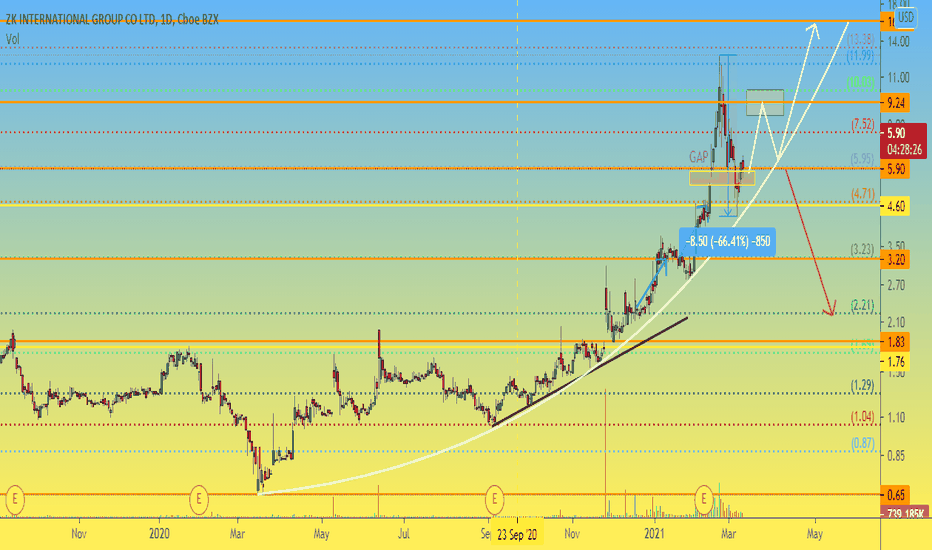
In fact, we made 7 exact ideas for growth from $1.80 to $14.60, pointing out the buy and sell zones during the growth.
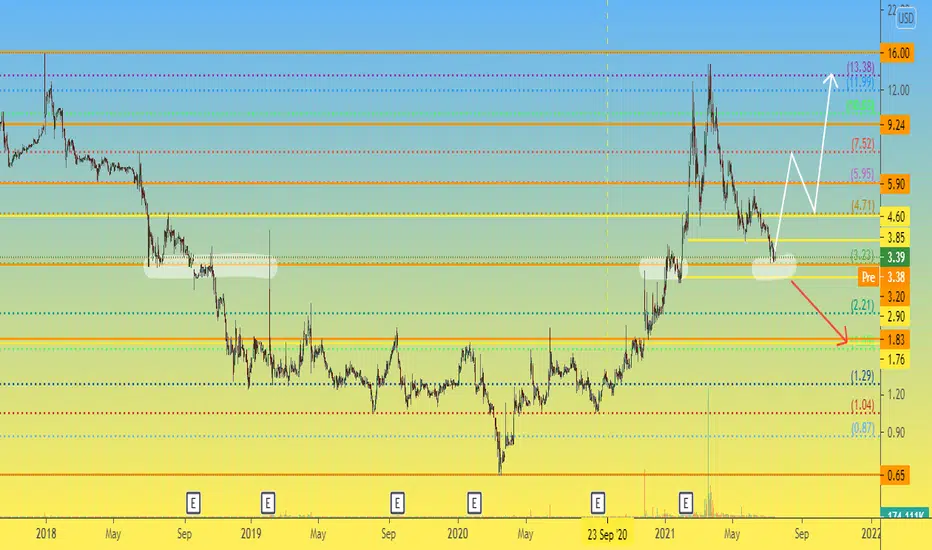
Since March 2021, there has been a correction on the ZKIN price chart. And finally, after 4 months of falling prices, signals from the chart began to appear that most likely ZKIN shares are buying again.
The fall stopped in the liquidity zone of $2.90-3.20. As you can see from the chart, this liquidity zone is a strong mirror level that has repeatedly played the role of reliable support and resistance.
And now we have two scenarios for the development of events in the future:
1) fixing the price below $2.90 will open the way for a fall and retest on the strength of the base of the "Head and Shoulders" pattern to the area of $1.80
2) Activation of buyers from current prices will open the way for growth first to $7.50, and globally to $14. Also, working out this scenario can form the "Cup with a handle" trend continuation pattern, but more on that in the next reviews.
In fact, we made 7 exact ideas for growth from $1.80 to $14.60, pointing out the buy and sell zones during the growth.
Since March 2021, there has been a correction on the ZKIN price chart. And finally, after 4 months of falling prices, signals from the chart began to appear that most likely ZKIN shares are buying again.
The fall stopped in the liquidity zone of $2.90-3.20. As you can see from the chart, this liquidity zone is a strong mirror level that has repeatedly played the role of reliable support and resistance.
And now we have two scenarios for the development of events in the future:
1) fixing the price below $2.90 will open the way for a fall and retest on the strength of the base of the "Head and Shoulders" pattern to the area of $1.80
2) Activation of buyers from current prices will open the way for growth first to $7.50, and globally to $14. Also, working out this scenario can form the "Cup with a handle" trend continuation pattern, but more on that in the next reviews.

🎁 -20% for ALL trading fees at #OKX 👇
okx.com/join/20PSTRADE
🔥 V-I-P 👉 t.me/P_S_trade_menue_bot
🔵 Telegram 👉 t.me/pstrade_eng
🤖 Trading Bot 👉 copytrading.space/en/
📞 t.me/P_S_trades 📝
okx.com/join/20PSTRADE
🔥 V-I-P 👉 t.me/P_S_trade_menue_bot
🔵 Telegram 👉 t.me/pstrade_eng
🤖 Trading Bot 👉 copytrading.space/en/
📞 t.me/P_S_trades 📝
相关出版物
免责声明
这些信息和出版物并非旨在提供,也不构成TradingView提供或认可的任何形式的财务、投资、交易或其他类型的建议或推荐。请阅读使用条款了解更多信息。
🎁 -20% for ALL trading fees at #OKX 👇
okx.com/join/20PSTRADE
🔥 V-I-P 👉 t.me/P_S_trade_menue_bot
🔵 Telegram 👉 t.me/pstrade_eng
🤖 Trading Bot 👉 copytrading.space/en/
📞 t.me/P_S_trades 📝
okx.com/join/20PSTRADE
🔥 V-I-P 👉 t.me/P_S_trade_menue_bot
🔵 Telegram 👉 t.me/pstrade_eng
🤖 Trading Bot 👉 copytrading.space/en/
📞 t.me/P_S_trades 📝
相关出版物
免责声明
这些信息和出版物并非旨在提供,也不构成TradingView提供或认可的任何形式的财务、投资、交易或其他类型的建议或推荐。请阅读使用条款了解更多信息。