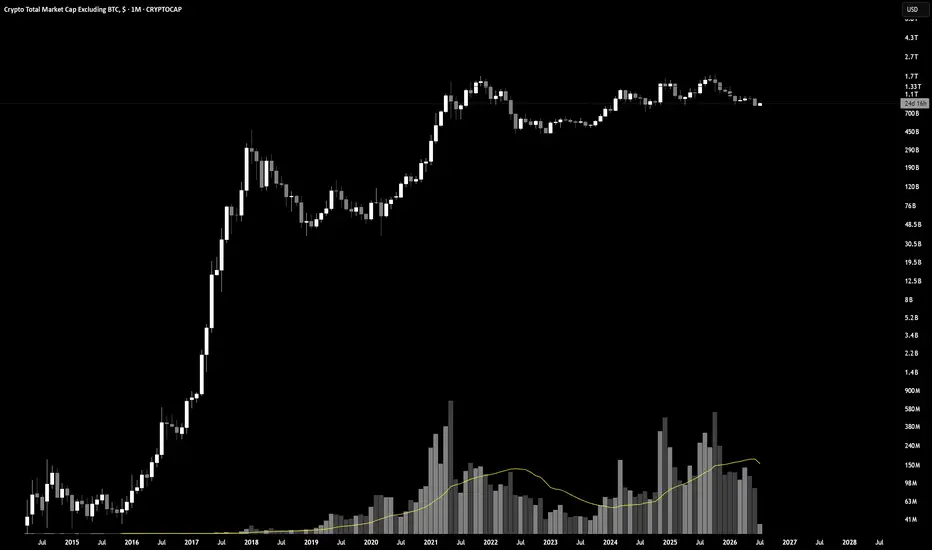
TOTAL2: Four-Year Reaccumulation Under the 1.33T CeilingThis is the widest possible lens on altcoin market cap, and the pattern only shows up at this zoom level. The 2017 cycle built one range, the 2021 peak built the next ceiling, and everything since has been compressing beneath that same 1.33T level for four straight years.
That's not distribution. Distribution would show declining lower highs into weaker and weaker bounces. This shows the opposite, repeated tests of the same ceiling with higher lows underneath each one, 2022's low, then 2023's, then a shallower base into 2024 and 2025. Each successive floor sits higher than the last.
In Wyckoff terms, this is a bull flag playing out as a multi-year reaccumulation schematic. The 2021 impulse was the initial markup. Everything since has been the market absorbing that move and building a new cause before the next effect, exactly the structure Continuation Acceleration Protocol treats as a regime gate still closed rather than a failed trend.
Volume tells the same story. The MA has been grinding higher since 2023 even as price has gone nowhere in absolute terms, participation quietly building underneath a flat price structure. That's classic absorption, aggressive selling met by aggressive buying at a level, without the level itself giving way.
The ceiling has rejected every test since 2021. That includes this cycle's most recent push. Until TOTAL2 closes a monthly candle above 1.33T with the range behind it instead of underneath it, this remains a base, not a breakout.
What invalidates the bullish read: a monthly close back below the 2024-2025 higher low structure, which would flatten the staircase and reopen the case for distribution instead. What confirms it: a monthly close above 1.33T, ideally with the volume expansion this base has been quietly building toward.
Marcus Aurelius wrote that the impediment to action advances action. Four years of failing to clear one number is either the longest rejection in crypto history or the longest base. The chart doesn't decide which. The next monthly close does.
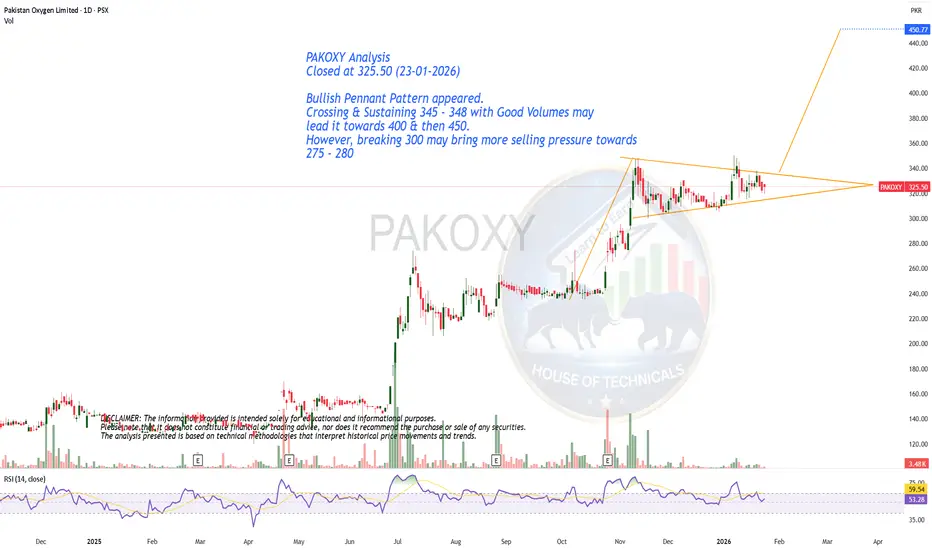
Bullish Pennant
Kotak Mahindra Bank LtdKotak Mahindra Bank continues to look fundamentally steady and technically constructive, with the last four quarters reflecting resilience in core banking performance, stable asset quality, and a strong balance-sheet profile. The setup supports a measured bullish view for the coming quarter and full year, especially if momentum in loan growth and margins sustains.
Fundamental view — Last 4 quarters & guidance
Over the last four quarters, Kotak Mahindra Bank has shown a consistent operating profile with healthy advances growth, stable deposit traction, and controlled credit costs, which has kept earnings quality intact. The bank’s earnings trend has remained supported by prudent underwriting, strong capitalization, and a high-quality liability franchise, which reduces downside risk even in a choppy market.
For the coming quarter and the full year, the key watchpoints are loan growth acceleration, margin stability, fee-income momentum, and management commentary on retail and corporate credit demand. If the bank continues to deliver disciplined growth with stable asset quality, the market is likely to reward the stock with a premium valuation.
Technical view — RSI, MACD & bullish indicators
Technically, Kotak Mahindra Bank is showing a constructive setup with RSI holding in a healthy zone, indicating positive momentum without a strong overbought condition. MACD remains supportive of the trend, and broader chart structure suggests that buyers are active on dips.
Other technical indicators are also leaning bullish, including price holding above key short- and medium-term moving averages, a favorable higher-low structure, and improving volume on upward moves. This combination points to a stock that is still in a trend-friendly phase as long as support levels hold.
Recommendation
Buy Kotak Mahindra Bank at 405 with stoploss of 395 for targets of 411.55, 418.20, 425, 431.85, and 439.
This is a disciplined momentum-plus-quality banking trade with a tight risk profile and defined upside targets.
Disclosure
Disclosure: I am not a SEBI registered analyst or technical advisor. This post is for educational and informational purposes only and should not be considered investment advice.
Axis Bank Ltd.Axis Bank looks well placed both fundamentally and technically — the bank has delivered steady operating performance over the last four quarters with improving loan growth, margin stability, and controlled credit costs, which supports a constructive outlook for the coming quarter and year.
Technically, momentum indicators and other trend measures are in bullish zones, supporting a tactical buy while keeping risk management strict.
Fundamental view — Last 4 quarters & guidance
Over the last four quarters Axis Bank has shown sequential improvement in core metrics: healthy loan growth across retail and corporate segments, stable net interest margins, and improving asset quality with lower slippages and higher provisioning coverage; these trends have supported stronger operating profits and helped the bank build a firmer earnings base.
For the coming quarter and financial year, the Street will watch loan growth sustainability, margin resilience as funding cost dynamics evolve, CASA traction, and management guidance on credit costs and capital deployment, all of which will determine near-term sentiment.
Technical view — RSI, MACD & bullish indicators
On the chart, RSI is in a constructive zone, showing strength without extreme overbought signals, and MACD is positive with the signal line supporting upward momentum, which together indicate continuation potential for the current up-move.
Other technicals like price above short- and medium-term moving averages, bullish moving-average alignment, rising volume confirmation, and a clean higher-high/higher-low structure add conviction that buyers remain in control as long as key supports hold.
Recommendation
Buy Axis Bank at 1380 with stoploss 1334.00 for targets 1407.05, 1434.65, 1462.80, 1491.50, and 1520.75.
This is a momentum-plus-fundamental trade: enter with defined risk, trail stops as targets are reached, and re-evaluate if price breaches the stoploss or if fundamental guidance disappoints.
Disclosure
Disclosure: I am not a SEBI registered analyst or technical advisor. This post is for educational and informational purposes only and should not be taken as investment advice.
ICICI Bank remains fundamentally solidICICI Bank remains fundamentally solid — the bank reported steady quarterly improvements with Q4 FY26 showing core operating profit growth and FY26 PAT rising to about ₹50,147 crore, while asset quality improved and the board recommended a dividend, which underpins a constructive fundamental base for the coming year.
Technically, momentum indicators (RSI, MACD) and other trend measures are aligned with a bullish bias, supporting a tactical buy as long as risk rules are respected.
Fundamental view — Last 4 quarters & guidance
Over the last four quarters ICICI Bank delivered sequential improvement in core operating metrics, led by healthy loan growth, steady NII expansion, and improving asset quality (gross NPA trending down and higher provisioning coverage), which helped FY26 PAT rise year‑on‑year to ~₹50,147 crore and supported a dividend recommendation of ₹12 per share.
Key monitors for the coming quarter/year are loan growth sustainability (retail and corporate), margin trajectory amid funding cost moves, fee income momentum, and operating‑expense control — management commentary here will drive near‑term sentiment.
Technical view — RSI, MACD & bullish indicators
Daily and short‑term technical dashboards show supportive momentum: RSI sits in a constructive mid‑to‑upper range indicating room to run without extreme overbought readings, while MACD is positive and has recently signalled bullish alignment with rising histogram bars.
Other indicators — price trading above key short‑term moving averages, bullish moving‑average alignment on shorter windows, and positive volume confirmation on up days — add conviction that the chart structure is in a bullish phase, provided key supports hold.
Trading recommendation
Recommendation: Buy ICICI Bank at 1370 with stoploss 1333.00 for targets 1388.75, 1407.75, 1427.05, 1446.60, and 1470.
This is a tactical, momentum‑backed trade that combines improving fundamentals with constructive technicals; maintain discipline — cut if price breaches the stoploss or if key technical supports fail.
Disclosure
Disclosure: I am not a SEBI registered analyst/technical advisor. This post is for educational and informational purposes only and should not be treated as investment advice.
Bullish Pennant Pattern Appearing!MTL Analysis
Closed at 569.71 (09-05-2026)
Positive Points:
> Strong Bullish Divergence
> 50% Retracement
> Fundamental Developments including sale of combined harvestor & also
buying some land for dairy business(not officially announced though).
> Bullish Pennant pattern; targeting around 1000 - 1100. However 750 - 770
is the strong resistance zone that needs to sustain for the upside target of 1000+
> Breaking 460 may bring more selling pressure towards 410 - 418.
$OIL Long - Keep Support Retest + Buy SignalOpened a Long here on NSE:OIL
I normally don’t trade OIL because of how manipulated the market is with all these Trump Pump n Dump tweets, but the setup looks a bit too juicy to pass up.
Currently testing support on the 100D MA which coincides with the bottom of the bull pennant.
If PA doesn’t fall out of the pennant, at the very least we have ~15% gain if price reaches $100, which seems extremely feasible considering there is no clear off-ramp whatsoever for the war in Iran and opening the Strait of Hormuz.
Note the B13 BUY SIGNAL on the TD Sequential.
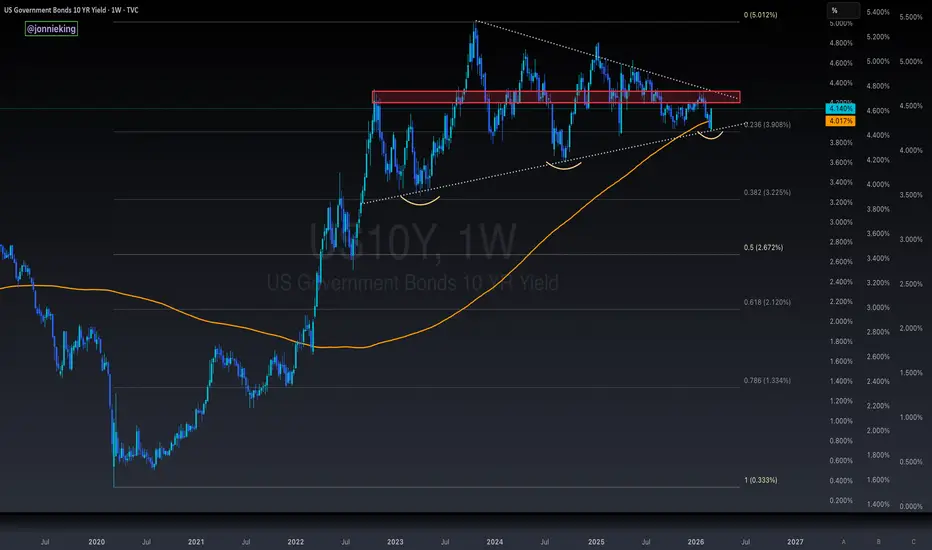
US10Y Massive Weekly Close Breakout - 5% Next !?THE US10Y IS THE BEACON OF TRUTH IN FINANCIAL MARKETS.
As predicted, the 10Y yield is back above 4.6% and have officially entered the danger zone.
The US Guvament has to refinance ~$9.8T of debt this year with the biggest intra-year cliffs in February and August.
I think we all remember what happened to CRYPTOCAP:BTC in February; don’t be surprised if we see the same in August.
If yields stay elevated for the next couple of Weekly Closes outside of this massive 6-year bull pennant, then I very much expect the 10Y back at 5% within the next several months.
Remember: Higher rates → more expensive mortgages, corporate loans, auto loans, etc. → less private borrowing and investment into the economy and risk assets.
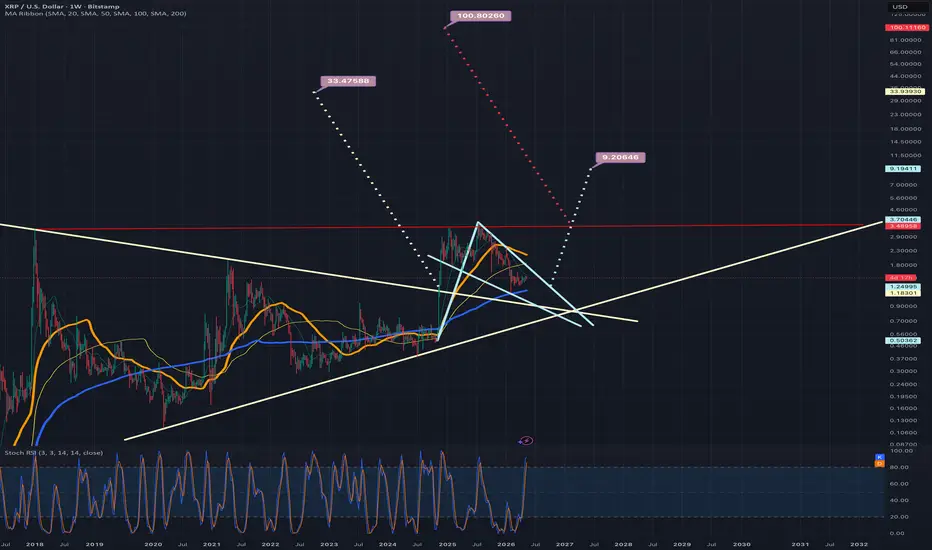
A daily chart version of the previous xrpusd logchart ideaIn addition to the weekly xrpusd log chart I just posted I figure it would be wise to also post the daily timeframe version of it too. If somehow the daily 50ma (in orange) can maintain support we will break up from this light blue pennant much sooner than where I have the dotted light blue line placed here. However, we also have the current resistance of the darker blue daily 200ma just overhead and we can see how it is starting to mimic the trajectory of the top trendline of the light blue pennant which will create double reinforced resistance in which case that could be enough to overcome the support of the orange 50ma in the short term. We will have to watch and see in the coming few weeks. The wedge on the linear chart suggests a breakout could occur within 1- 2 weeks time or so. I will link both the linear wedge chart and the weekly version of this log chart down below *not financial advice*
An updated look at the weekly logchart for xrpusdWe can see price action is currently consolidating inside a bull pennant that I have colored light blue here and as long as the blue 200 weekly MA maintains solid support price should break upward from the pennant by the time it reaches where I have placed the dotted measured move line. If that is the point at which it breaks out the target is around $9.19 or so but on my linear weekly chart (not shown here) price is currently a weekly candle or 2 away from breaking above the top trendline of a wedge on that chart that has a breakout target around 3.09 or so. So if that linear wedge plays out odds are good we would also breakout up from this log chart pennant considerably sooner than where I have arbitrarily placed the dotted line, in which case the price target for this log pennants breakout would be even higher than 9.18 potentially even above 10 dollars at that point. We can also see that we have two other even bigger chart patterns here on this weekly log chart as well. The tan colored symmetrical triangle, and the ascending triangle with the red line as its top trendline. The tan triangle’s breakout target around $33 and the ascending triangles target all the way up at $100. Being a log chart, some of these bigger patterns will take much longer to hit their targets than the linear chart patterns usually take to reach theirs, however I believe we are very likely to hit the smaller light blue pennant’s breakout target by sometime next year at the latest and possibly even this year, I have included the linear weekly wedge chart for xrpusd in a link below *not financial advice*
Bull pennant on monthly btcusd log chartIf the monthly 50ma (in orange) can find a way to maintain solid support, then bitcoin should breakout upward from the current bullpennant right around where I arbitrarily placed the dotted purple line. This would give the bull pennant a breakout target of around 460k. Of course, Being a logarithmic chart pattern on a 1 month timeframe, this target could take several years to reach. *not financial advice*
Bullish PennantEnd of April - middle of May is when we should break out of this bullish pennant. If the market as a whole has the volume at that time it should be easy for us to break out hitting new ATH. But if the market decides to go down around this time, it would seem that
BLUAI has found its bottom with a strong support at $0.004845.
Some people are saying the bear market can end starting Q2 while others are saying Q3/Q4 with next year 2027 being the bull year into 2028. What do you think?
Bullish pennant pattern appearing.CPHL Analysis
Closed at 84.16 (27-02-2026)
Bullish pennant pattern appearing.
Staying above 81 on weekly basis is OK.
else, next support lies around 74 - 76 & then around 64 - 65.
Immediate resistance is around 87 - 88
Breakout above 110 with good volumes may lead it towards 175 - 180.
Breaking 52 may start downtrend.
TAO / USDT : Strong above support and Ready for a bullish moveTAO / USDT is looking so good above the $283 – $289 levels…
If we see a clean retest and price holds above this zone, I’m expecting a strong upward movement towards $350 – $400 in the coming days. Momentum is picking up and structure is turning bullish step by step.
Manage risk wisely and follow the chart carefully… Breakdown below this zone will invalidate the setup.
NATIONALUM Price ActionGiven the strong fundamentals, modest valuation and decent downside support, the stock appears to be in a relatively attractive value zone.
If I were setting up a trading/investment plan, I’d consider the following:
Entry near current or slightly lower (₹ 240-250) with a stop perhaps below ₹ 230 for downside protection.
Upside target in the mid-₹ 270s (~10-15% from here) if a breakout happens.
Keep an eye on commodity/metal cycle signals and confirm volume/price action before committing.
If risk appetite is higher, treat this as a longer-term hold rather than short-term trade given the PSU/commodity nature.
Teva: The flag’s ready — someone just needs to hit “launch”Teva Pharmaceutical (TEVA) is setting up for a potential continuation move after a clean impulse. On the daily chart, we have a textbook bull pennant — and not just any sloppy one. Price has broken above the 200-day moving average, and all key EMAs (50/100/200) now sit below price, confirming a solid bullish structure.
Volume behavior fits the script: declining inside the pennant, signaling pressure is building. More importantly, the Volume Profile reveals a low-volume void above current levels — meaning there’s little resistance until we hit the $22+ zone. In other words, once this breaks, it could run fast.
RSI is comfortably in bullish territory without being overheated, and the flagpole projection gives us clean upside targets:
– Entry: breakout above pennant resistance
– Target: $22.80 — full flagpole height
– Support: $17.60 — confluence of 0.5 Fib + volume base
TEVA isn’t asking for confirmation anymore — it’s showing it. All systems are technically armed. Now we just wait for the market to press the button.
INTC Target Hit, Now Showing Another Bullish Setup!INTC - CURRENT PRICE : 41.53
My earlier INTC buy call has reached its projected targets. The previous analysis is shared below for reference.
Technical Highlights
1) New 52-week High – Price has broken into a fresh yearly high, confirming strong bullish momentum.
2) Pennant Breakout – The breakout from a bullish pennant pattern suggests continuation of the prior uptrend, with a potential target of $49 based on the pattern projection.
3) Golden Cross Intact – The 50-day EMA remains above the 200-day EMA, maintaining the long-term bullish bias.
4) RSI in Bullish Territory – RSI remains above 70, indicating strong momentum and persistent buying strength.
ENTRY PRICE : 40.00 - 42.00
FIRST TARGET : 45.00
SECOND TARGET : 49.00
SUPPORT : 36.43 (the low of 23 OCTOBER 2025 candle)
ETH ANALYSIS🔴 #ETH Analysis : ❓❓
🔮There is a formation of "Bullish Pennant Pattern" in #ETH in 4HR time frame. We can expect around $4850 bullish move if the price break the pattern.📈
⚡️What to do ?
👀Keep an eye on #ETH price action. We can trade according to the chart and make some profits. ⚡️⚡️
#ETH #Cryptocurrency #Breakout #DYOR