Cardano: dip or bounce? key levels for the next few daysCardano
Dip hunters, you watching this? ADA just got hammered again as the market cools off after the latest risk‑off wave, while industry chatter is all about majors rotating into “safer” names and stables. According to market sources, sentiment on alt L1s is shaky, but that’s exactly when the best mean‑reversion plays usually sneak in.
On the 4H chart we’re sitting right on a huge demand zone around 0.245, with multiple wicks rejecting the same orange block. RSI is buried in oversold territory and curling, hinting at seller exhaustion, and volume picked up right as price tapped this base. I’m leaning long here, looking for a bounce back toward the local supply bands around 0.255 then 0.265 if momentum follows through.
My game plan: aggressive bulls can stalk entries inside this orange zone with invalidation slightly below the recent low; conservative traders can wait for a clean 4H close back above 0.25 to confirm buyers are alive. Base case for me is a relief move into 0.26, but if this support snaps and we close below the zone, I’d flip bias and look for a deeper flush instead. I might be wrong, but ignoring a major support with oversold RSI has punished me more than once. ✅ Dogecoin: major support in sight? key levels to watch this weekDogecoin
Who else is watching this meme dinosaur quietly sitting on a major support block? According to market chatter, flows are slowly rotating back into large caps while speculative memecoins cool off, and DOGE has been grinding lower on fading volume. On today’s 4H chart price is parked right on that big orange demand zone that has been defended multiple times this month.
On the 4H, RSI is hovering near the low 30s, showing sellers are tired but not fully washed out yet. I’m leaning bullish from this area: price keeps wicking into the orange box and snapping back, classic “smart money accumulating while retail panics.” If buyers manage to hold this base, a mean‑reversion move toward the 0.09 region and then the red supply band above looks realistic as shorts take profit.
My game plan: I like spot or small leveraged longs inside the orange zone with invalidation just below the green support box. Base case – bounce toward 0.09 and, if momentum and volume confirm, extend into the upper red zone. ⚠️ If we lose the green box with a strong 4H close, I assume the bulls fumbled and I’ll step aside, looking for cheaper entries lower. I might be wrong, but this looks like classic DOGE “sleepy range before surprise wake‑up.” Gold Deep Correction Complete? High Probability Reversal ZoneHello Traders!
Gold has reacted strongly from a major higher timeframe resistance, showing multiple rejections before the recent sharp decline. The market has now reached a key demand zone, where previous buying interest and liquidity are present.
This area becomes critical because it represents a zone where weaker hands often exit, while stronger participants look to accumulate positions. Such moves typically create conditions for a potential mean reversion and recovery.
If price manages to hold this demand zone, we can expect a gradual upside move toward the marked recovery targets, aligning with previous structure levels.
On the other hand, if this level fails, the bullish expectation weakens and further downside can open up. That’s why the invalidation level below is important to watch.
The key here is not prediction, but patience, let the market confirm strength before stepping in.
Rahul’s Tip : Strong moves don’t start at highs, they begin where fear is highest and support is strongest.
Disclaimer: This analysis is for educational purposes only and should not be considered financial advice. Always manage your risk properly before taking any trade.
— @TraderRahulPal
SCA Registered Financial Influencer (Dubai, UAE)  Long
Long
Decentraland: is the metaverse back? key levels to watch todayDecentraland. Still watching the metaverse zombies or already back hunting opportunities here? According to industry sources, interest in gaming and metaverse names is slowly waking up again as risk appetite improves, and today’s headlines about fresh funding in virtual world projects helped sentiment. MANA has quietly bounced from the lower demand zone while everyone chases the shiny AI names.
On the 4H chart, price is pushing into a thick red supply block after a sharp V‑shaped recovery, with RSI climbing from oversold back above 50. I’m leaning bullish short term, expecting a grind toward the next liquidity pocket above, as late shorts get squeezed and dip buyers defend the recent higher low. As long as this mini uptrend of higher lows holds, I see this as accumulation, not just a dead cat.
My base plan: I like longs on shallow pullbacks above the green zone, targeting the upper red area where previous selling hit. If price rejects hard and closes back below the current red band, that opens the door for a slide toward the green support for a deeper reload. I might be wrong, but for now I’m treating MANA as a patient swing long and I’ll start taking profits into those higher liquidity levels. ZRO: bounce or pullback? key levels to watch this weekZRO
Is this little airdrop kid about to grow up or fade back to the sandbox? ZRO just bounced hard from that green demand zone while the market keeps talking about fresh liquidity and new listings for this name, so attention is back on it. According to industry chatter, spec money is rotating into newer L2 plays again, and you can see that excitement straight on the chart.
On the 4H, price reclaimed the prior breakdown level and is pushing into the 2.20 area with RSI already near overbought, so I’m favoring a short‑term pullback before any moon talk. Volume on the bounce is solid, but we’re running into local resistance where late buyers usually get trapped. I might be wrong, but this looks more like a “cool off first” move than a straight vertical pump.
My base plan: I want to see a retrace toward 2.05–2.00 and hold that as support, then a second leg toward the recent highs around 2.35 and possibly a spike into 2.45 if momentum stays hot ✅. If 2.00 snaps and price slides back into the green zone around 1.90–1.80, I flip the bias to a deeper consolidation. I’m waiting for that dip instead of chasing here, letting the FOMO crowd test the waters first. ZK: hunting the dip? key levels and targets for todayZK
Catching the ZK dip or did you already panic sell the bottom? L2 and restaking narratives are back on headlines according to market chatter, and speculative capital keeps rotating into smaller caps after the recent moves in majors. Today ZK printed a sharp bounce right as sentiment turned and funding cooled a bit, which is usually when smart money starts hunting discounts.
On the 4H chart price is reacting cleanly from that big orange demand block after an oversold RSI bounce, with buyers stepping in on rising volume. As long as we hold this zone, I’m leaning toward a corrective push up into the first red supply band above, where previous longs got trapped. I might be wrong, but this looks more like a relief rally brewing than a dead-cat bounce.
My base plan: ✅ look for dips inside the orange area for low-leverage longs, targeting the mid to upper part of the red zone as take-profit, scaling out on the way up. If price loses the bottom of the orange block and RSI rolls over again, then I flip the script and expect a deeper flush to the next untested levels below. I’m stalking entries, not chasing green candles here. XPLUSDT: ready for a bounce? key levels to watch this weekXPLUSDT
Who else is watching this little alt bleed into a monster demand zone and thinking “bounce time”? On the crypto side, sentiment has cooled off after the recent hype wave, and according to the market a lot of small caps are being flushed as liquidity rotates back into majors. That’s exactly when I like to hunt oversold plays with clear invalidation.
On the 4H chart, XPLUSDT just tapped a thick orange support block that has previously launched strong rallies, while RSI is grinding out of oversold around 30. Price printed a sharp rejection wick from the lows, hinting at fresh buyers stepping in. As long as we hold that orange zone, I’m leaning long, looking for a relief move back toward the mid-range resistance above.
Here’s my simple plan ✅
• Base case: hold the orange demand and squeeze up toward the first red zone above as a take‑profit area.
• If price loses the bottom of that zone and closes 4H below, I assume bulls are dead and a deeper drift lower is on deck. I might be wrong, but until that floor breaks I treat this as an accumulation dip and I’m interested in staggered longs, tight risk under the lows. Jasmy: dip buying opportunity? key levels for the next few daysJasmy – catching a falling knife or loading the dip? According to the market, small caps like this have been under pressure while traders rotate into the majors after the latest macro risk headlines and rate talk. Today Jasmy printed fresh lows on Binance, but price is now sitting right above that big green demand zone that previously launched the last leg up.
On the 4H chart we’re clearly in a downtrend, but RSI is buried in oversold and starting to curl, hinting at seller fatigue. I’m watching for a bounce from this green area back into the red supply blocks above, with first trouble around the mid range and then the prior breakdown zone. If buyers react here, short covering plus dip hunters could easily squeeze this higher.
My game plan: I’m interested in a speculative long off the green zone with a tight invalidation just below it, targeting a move back toward the nearest red resistance. ✅ Base case – relief bounce into that zone, then I’ll reassess. If price slices clean through demand and RSI stays heavy, I step aside and let it drift to the next major support below. I might be wrong, but ignoring oversold bounces on coins like this has cost me more than catching a few stabs with clear risk. Compound: brewing opportunity? key levels to monitor for todayCompound
Anyone watching COMP quietly coil here while the rest of DeFi grabs headlines again? According to the market, renewed interest in lending protocols and rising on‑chain activity around governance tokens is slowly waking this sector up. Today price is still stuck under that heavy red supply zone above, but bulls haven’t fully let go of control yet.
On the 4H chart, RSI is cooling off from mid levels and price is pulling back toward the green demand area around 18.2‑18.0, which lines up with recent volume support. As long as that box holds, I’m leaning long, looking for a rotation back into the upper range and a possible stab at the 19.5‑20 zone where we last saw strong selling. If fresh DeFi hype continues, that supply could get eaten faster than people expect.
My plan: ✅ watch for a wick into the 18.2‑18.0 zone with a bounce and reclaim of intraday highs, then I’m interested in longs targeting 19.3 first and 19.8‑20 next. If price closes cleanly below 18.0 and stays there, I flip the script and look for a slide toward the next green block near 17 and maybe 16.5. I might be wrong, but right now COMP looks like a dip I’d rather buy than short. WIFUSDT: bounce or breakdown? key levels to watch todayWIFUSDT
Are memecoins about to get a second wind, or is this bounce done? According to the market, meme names cooled off after the last hype spike, but funding and open interest are stabilizing again. Today we saw headlines about renewed interest in dog coins, and WIF barely flinched on the dip – that usually means strong hands are still in.
On the 4H chart, price is sitting right on that thick orange demand zone around 0.17, where we had the last sharp bounce. Volume has been heavier on dips into this area and RSI is near the lower band, hinting at seller exhaustion. As long as this orange block holds, I lean toward a short term long scenario back into the red supply zones above.
My plan: I’m stalking entries inside or just above the orange zone with targets toward the mid red area first, then the upper red band if momentum kicks in. Base case ✅ bounce toward previous local highs, but if 0.17 breaks clean and we close below into the green zone, I treat it as a failed setup and look for entries lower. I might be wrong, but for now this looks like classic “buy the fear, sell the hype” territory. FLOW: bounce or drop? key levels and targets for todayFLOW
Who’s brave enough to touch a chart that looks like a ski slope straight to zero? According to market chatter, FLOW’s been under pressure with weak liquidity and fading hype, but lately the headlines about ecosystem updates and partnerships are starting to creep back in. That’s usually when smart money quietly accumulates while everyone else memes it to death.
On the 4H chart we’re sitting on a heavy demand pocket after a brutal bleed, with RSI stuck in oversold but curling up. I see a tiny descending wedge/rounding base forming, plus a visible volume bulge right below price, so I’m leaning toward a relief bounce rather than another full leg down. If buyers step in, the first magnet for me is that 0.03 zone, then the thicker supply area around 0.035–0.04.
My plan: I’m hunting longs on dips near current support, targeting the 0.03/0.035/0.04 clusters and taking partials on the way up ✅. If this base cracks and we close a 4H candle clean below the recent low, I assume the bounce idea is dead and I’m out, waiting lower instead. I might be wrong, but ugly charts like this are often where the sneaky 30–50% bounces are born. Zetachain: support or sell-off? key levels and targets aheadZetachain. Who’s watching this support zone with me? Recently the market has been punishing newer L1/L2 names while liquidity rotates into majors, and according to industry sources, on‑chain activity here has cooled off a bit. Price has been bleeding for days, and now we’re parked right on that big orange demand block where buyers last defended hard.
On the 4H chart, price is hugging the bottom of that zone while RSI sits in the low 30s, so sellers are getting tired but haven’t fully let go. I’m leaning cautiously long from this demand, looking for a mean‑reversion pop back into the mid range above, where we see previous consolidation and heavier volume. If fresh ecosystem headlines drop, this area can turn into a springboard pretty fast.
My plan: I like layered bids inside the orange zone with a tight invalidation just below it, aiming for a bounce into the higher resistance band above as first take‑profit. If this level cracks and we close a few candles below, I stop out and let it drift into the green zone, where the next real bargain hunt starts. I might be wrong, but ignoring a major demand zone with oversold RSI has never been my style. ✅ MERL: ready for a bounce? key levels and targets to watchMERL
Who’s brave enough to knife‑catch this one? MERL just got hammered with the rest of the alt market after the latest risk‑off wave in crypto, as traders rotate back into majors according to industry sources. Today’s headlines about increasing regulatory noise around smaller projects are not helping sentiment, so liquidity is thin and moves are exaggerated.
On the 4H chart, price is parked right on that green demand zone after a vertical dump, while RSI is buried in oversold territory with early signs of flattening. I’m leaning toward a relief bounce long from here, targeting the nearest liquidity pockets around 0.033 and then 0.036, where previous volume spikes and a big supply block sit. If buyers actually show up, this could turn into one of those classic “dead cat that jumps higher than expected” squeezes.
My play: I’m stalking reactive longs in this demand area, with invalidation just under the recent low so the risk is tight. Base case, we grind up into 0.033 then 0.036, and in a full squeeze 0.04 is on the table. ⚠️ If this zone fails and we close 4H candles below it, I step aside and let it bleed lower – I might be wrong, but I don’t argue with fresh lows. BSV: are we facing another dump? key levels to watch todayBSV – ready for another dump or sneaky reversal? While majors steal the spotlight, BSV has been sliding after recent headlines about tightening scrutiny on older fork projects, and the market clearly lost interest for now. Volume dried up on the way down, then spiked as price stabbed below that big orange demand block on the 4H chart.
On the 4H, price is trading under the mid‑range, RSI is weak and hugging the lows, and the last bounce attempt from orange supply was instantly sold off. That keeps me leaning short, targeting the green zone below as the next liquidity pocket where late longs might finally capitulate. According to the footprint of volume and this failed range breakout, sellers still own the tape.
My plan: as long as BSV stays below the orange band, I treat bounces into it as potential short entries, aiming toward the green zone as a take‑profit area ✅. If buyers suddenly reclaim the orange zone with strong candles and RSI back above mid‑line, that invalidates the short thesis and opens the door for a squeeze back into the red resistance above. I might be wrong, but for now I’m staying bearish until price proves otherwise. ENS: pullback or bounce? key levels to watch this weekENS
Anyone else watching ENS bleed back after that sharp run up? According to market chatter, interest in naming and identity plays picked up again with the latest crypto rotation, but today buyers clearly stepped aside and price reacted instantly. That makes this pullback pretty important: are we just cooling off, or is this the start of a deeper flush into the old demand zone?
On the 4H chart, price is rolling over from a red supply block with RSI dropping out of overbought, so I lean short term bearish. I’m watching the low volume “air pocket” under current price – if sellers keep pressing, the path of least resistance is down into the green demand area around the mid 5s, where we previously saw strong bids. With sentiment still broadly positive for ENS fundamentals, I see this more as a potential dip zone than a full trend break.
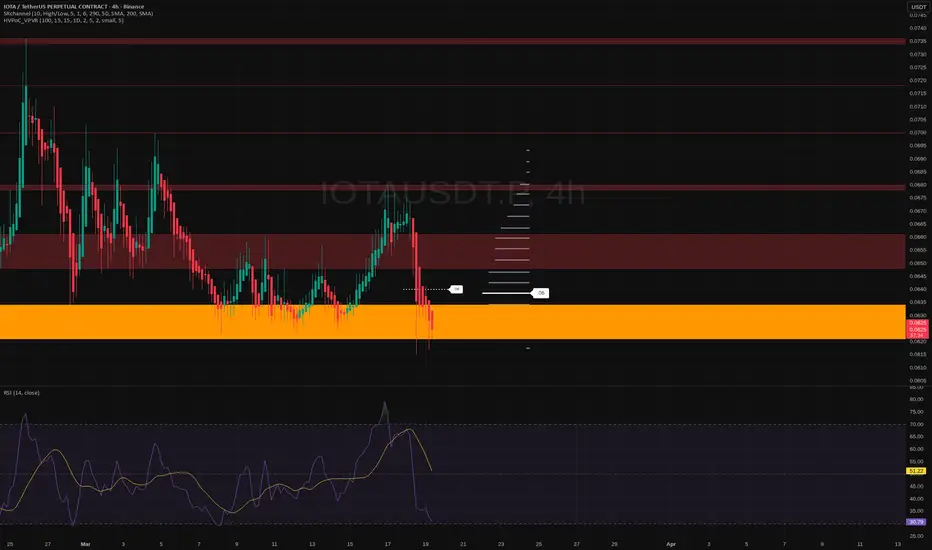
My base plan: I let it drift lower toward that green support, then look for a bounce setup with clear wicks and RSI curling up ✅. If bulls defend there, I’m hunting a move back toward the red supply zone above, where I’d start taking profit. If that green block snaps and we close 4H candles below it, the idea is invalid for me and I’d step aside – I might be wrong, but I’m not arguing with a clean breakdown. IOTA: bounce or bleed? exploring key levels for todayIOTA
Catching this dip or letting it bleed out? According to industry sources, sentiment on smaller alts turned cautious after recent macro jitters and Bitcoin’s dominance push, and IOTA got dragged right back into its old demand zone. Today we saw a flush straight into that big orange support area, while news around ecosystem development stays quiet and the market is clearly in “prove it” mode.
On the 4H chart, price is sitting on a major historical demand block around 0.062 with RSI buried near oversold, which screams “potential bounce” to me. I’m leaning bullish from this zone, looking for a mean reversion back into the 0.066 - 0.070 red supply band if buyers show up with real volume. I might be wrong, but this kind of vertical drop into support is often where smart money quietly reloads.
My plan: watch for a 4H candle that rejects the orange zone and closes back above roughly 0.063 with rising volume ✅. That opens the door for a swing toward 0.067 first, then maybe 0.07+. If bulls fail and we get a clean 4H close below the orange block, I flip the script and expect continuation lower, so I’d cut longs and wait for the next level down instead of trying to be a hero.