VeChain: bouncing back? key levels and targets for the next daysVeChain. Wondering if this old supply-chain dinosaur still has some life left in it? While majors grab the headlines, according to industry sources VeChain keeps popping up in real-world adoption talks and green-tech narratives, and traders are quietly rotating into beaten-down L1s again. That combo plus this chart setup has my attention.
On the 4H chart VET just bounced cleanly from a chunky demand zone around 0.0066-0.0070, with RSI ripping from oversold to above 50 - classic momentum reset. VPVR shows a volume shelf just above price, so a push through 0.0073 opens the door toward the next red supply band around 0.0078-0.0084 and, if momentum sticks, even a liquidity grab closer to 0.01. I might be wrong, but this looks like the first real higher low we have seen in a while. ✅
My base plan: look for longs on dips back into the green zone, as long as price holds above 0.0066, aiming for partial takes near 0.0078 then 0.0084+. If buyers completely fumble and we close back under 0.0066 with RSI rolling over, I flip the script and expect another leg down toward fresh lows instead. For now I’m flat and waiting for either a clean retest of support or a strong 4H close above 0.0073 to confirm the breakout.
Demand Zone
Flare: breakout or fakeout? key levels and targets aheadFlare – ready to finally wake up or just another fakeout? Recently, ecosystem headlines about new integrations and growing DeFi activity have put this chain back on traders’ watchlists, and you can see price reacting with a clean bounce off that green demand zone. Altcoins are getting a bit more risk‑on according to the market, so FLR is trying to join the party.
On the 4H chart we just broke out of a tight range and pushed into the orange high‑volume resistance block around 0.009. RSI is back above 50 and rising, showing momentum but still with room before overbought. If buyers can hold above the middle of this orange zone, there's a clear air pocket on the volume profile that can let price drift toward the red supply area near 0.01.
My base case: I’m looking for a retest of the orange zone as support and then a grind up toward 0.0096–0.0100 ✅. If price closes back inside the green demand and loses that 0.0086 area, the bounce is likely over and we can easily revisit the lows or make fresh ones. I might be wrong, but for now I’m stalking longs on dips with tight invalidation just below the recent higher low.
Cosmos: ready for a bounce? key levels and targets to watchCosmos holders still alive out there, or did this bleed put everyone to sleep? Recently the market has been rotating into majors again, while according to industry sources the Cosmos ecosystem keeps shipping cross‑chain upgrades but price is still lagging hard. That combo often sets up those sneaky mean‑reversion pops.
On the 4H chart, price is camped right on a thick demand zone around 1.72‑1.78 (orange box) after a long downtrend. RSI is curling up from oversold with a small bullish divergence, and the biggest local volume node sits higher around 1.85, so I’m leaning toward a short‑term bounce rather than fresh lows. I might be wrong, but this looks more like exhaustion selling than aggressive distribution.
My base plan: as long as that orange zone holds on 4H closes, I’m eyeing a move into 1.84‑1.86, with stretch potential toward 1.92 where previous supply kicks in ✅. If we lose the box and start closing below ~1.70, I flip the script and expect a slide toward 1.60 and I’m not interested in longs there. Personally I’m waiting for a clean 4H close back above 1.78 to join any bounce instead of knife‑catching.
ARB: ready to reclaim highs? key levels and targets for todayARB – ready to squeeze some shorts or just another dead cat bounce? L2 names have been beaten up while majors chop, and according to market chatter, attention is slowly rotating back into the ecosystem again. ARB just reacted nicely from a big 4H demand block, so this zone matters right now.
On the 4H chart, price bounced out of the green support area and is curling up toward the high-volume node around 0.10. RSI has ripped from oversold back above 50, which usually means the sellers are getting tired and dip-buyers are finally stepping in. I’m leaning toward a grind higher into the red supply zone around 0.103-0.106 over the next sessions.
My base plan: look for longs on shallow pullbacks that still hold above roughly 0.094, targeting that 0.103-0.106 band ✅. If we get a 4H close back inside the lower green zone (around 0.092 and below), I assume the bounce failed and I’ll step aside, watching for a deeper sweep toward the lows ⚠️. I might be wrong, but shorting straight into this fresh demand feels like playing chicken with the market.
QNT: ready to rally? key levels and targets to watch todayQNT – wondering if this range zombie finally wakes up? While majors keep stealing the spotlight, according to market chatter a lot of infra coins like QNT have just been grinding sideways and bleeding into support. That pullback has now driven price straight back into the big green demand block around 60‑62, where buyers previously defended hard.
On the 4H chart, price is sitting on that demand while RSI is curling up from the low 40s, trying to build a higher low. VPVR shows a fat volume node right above at 63‑64 that usually acts like a magnet, with the next supply stacked in the red zone up to roughly 66‑67. So I’m leaning long, looking for a relief bounce as late sellers get squeezed. I might be wrong, but shorts pressing it into this demand look like they’re arriving after the move.
My plan: accumulate inside 60‑62 with confirmation from a strong 4H bullish candle. Base case is a push to 63‑64 first, then 66‑67 if momentum and volume follow through ✅. If price closes cleanly below the green zone (around 59), the idea is invalidated for me and I’d step aside and even consider a short on a retest of 60 from below, targeting lower liquidity pockets.
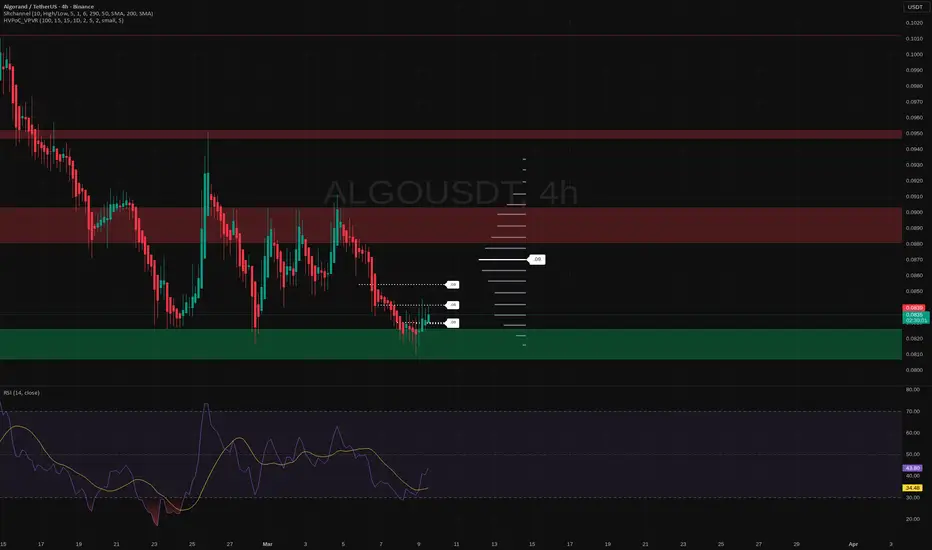
Algorand: dip or trap? key levels for the next few daysAlgorand – is this dip a gift or a trap? Altcoins are waking up again as traders rotate out of the majors, and ALGO is sitting right on a big historical demand zone. According to market chatter, developers keep pushing upgrades on the chain, so if sentiment flips even a bit, this one can move fast.
On the 4H chart, price is parked in that green demand block around 0.082 with several rejection wicks and rising volume. RSI bounced from oversold and is curling up, while the volume profile shows a fat liquidity pocket up near 0.088–0.09 that can act like a magnet. That combo makes me lean long here, looking for a short squeeze rather than new lows.
My base plan ✅: buy the dip in the green zone with invalidation just under the recent low, aiming first around 0.086 and then the red supply area near 0.09. If we get a clean 4H close below support with strong volume, I flip the script and expect a slide toward sub‑0.08 instead. I might be wrong, but I’d rather take a defined‑risk stab at the bounce than chase it after it’s gone.
TRUMP: oversold bounce ahead? key levels to watch todayTRUMP. Tired of watching this thing bleed every day? According to market chatter, the latest political headlines cooled off the whole "presidential meme coin" sector and TRUMP has been in straight sell mode, but now price is finally landing on an interesting 4H level.
On the 4H chart we’re sitting in a fresh demand zone around 2.9-3.0 while RSI is buried below 30 with a small bullish divergence starting to show. Volume profile shows the fat liquidity sitting higher, around 3.13 - 3.20 and then 3.4, so I’m leaning toward a relief bounce rather than a brand new bull run. I might be wrong, but this looks like classic oversold-then-squeeze setup. ✅
My base plan: I like cautious longs in the 2.9-3.0 area with eyes on 3.13 first, 3.20 next and a stretch target near 3.4 if momentum really kicks in. If price closes cleanly below this demand zone and stays under 2.9, I drop the long idea and expect continuation into the lower liquidity pocket below, where I’d then look for the next bounce zone instead. For now I’m watching how the next few 4H candles react here before sizing up.
Skycoin: ready for a comeback? key levels and targets aheadSkycoin. Ready for round two on this forgotten alt, or was that pump the whole story? While majors chill after the latest BTC move, according to market sources traders are rotating into old-school small caps again, and Skycoin just had a vertical spike followed by a sharp flush. Price is still holding above the early March base, so the dump looks more like a clean-up than a full rug… so far.
On the 4H chart, price is sitting right on the first green demand zone around 0.07 after a big liquidation candle. Volume climaxed on the drop and is fading, while RSI bounced from oversold and is curling back toward the midline. That combo screams potential bounce to me, with the nearest liquidity magnets around 0.075 - 0.08.
My base plan: I like longs only while we hold this 0.07 box, hunting wicks into 0.07 - 0.068 with bullish reaction and targeting 0.075 first, then 0.08. If we get a 4H close below that lower green zone, I flip bias and look for a deeper sweep into 0.065 - 0.062 instead. I might be wrong, but I’m not buying the narrative that this move is dead just yet. ✅ Long bias above 0.07, ⚠️ trend flips if support cracks.
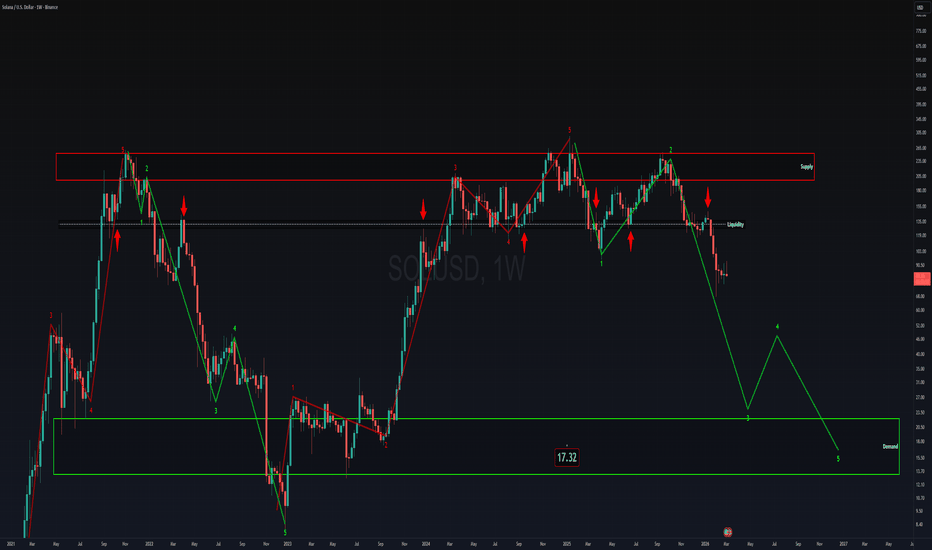
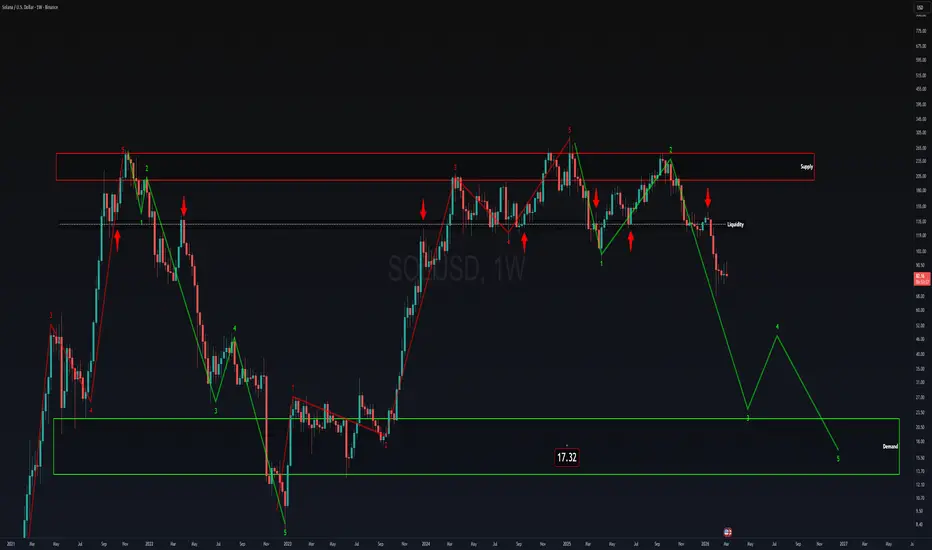
SOL | Price Hunts for Deep-Double-DigitsThis chart should speak for itself.
Repeating cycles of Elliott Impulse Wave capturing price action in a large range. Similar to BINANCE:RAYUSDT we can expect more downside to come. These charts share the same major liquidity zone along with a bunch more tickers showing the exact same setup.
Since price is locked in this contraction phase the only feasible support lvl is back at FTX lows ($17).
KuCoin Token: poised for a bounce? key levels to watch!KuCoin Token – tired of staring at BTC chop and want something with a cleaner story? Exchange tokens have been in the spotlight again as regulators circle centralized venues, but at the same time trading volumes are creeping up, which usually breathes life into fee‑discount tokens. According to market chatter, KuCoin has been pushing new listings and campaigns, keeping KCS on the radar despite the recent dump.
On the 4H chart, price is parked right in a chunky demand zone around 7.6‑7.9 where the volume profile is fattest and buyers previously defended. RSI has curled back above 50, so momentum is slowly flipping from “panic sell” to “bargain hunt.” I’m leaning long from this green box, looking for a rotation into the first red supply near 8.2 and potentially the upper band around 8.6 if the move extends.
My base case: hold above the green zone and we grind toward those 8+ targets ✅. If we get a clean 4H close below roughly 7.6, that invalidates the idea and opens room for a flush toward the 7.0 area, where I’d step aside and reassess or look for a lower reload. I might be wrong, but if they nuke it into 7.0 I’ll happily admit I was early and hunt for entries where the fear is max ⚠️.
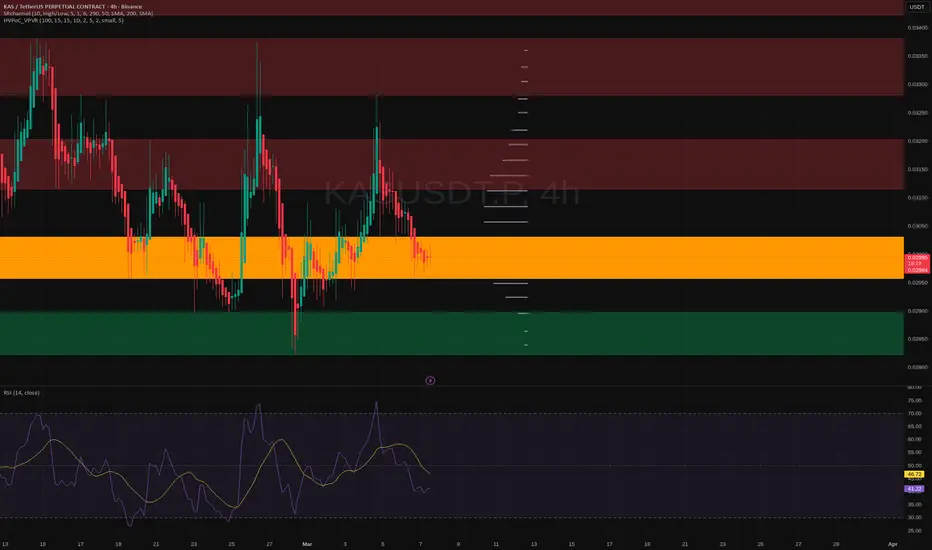
KAS: ready for a bounce? key levels to watch in the next daysKAS. Watching this or still pretending you’ll “buy the dip later”? Kaspa has been one of the louder names in the PoW corner, and with alt focus rotating again, these local levels on KAS look way more interesting than the timeline drama.
On the 4H chart price is sitting right in that thick orange demand/volume node around 0.029, where buyers have defended multiple times. RSI cooled down into the low 40s, so the froth is gone and there’s room for another leg up. As long as we hold this block, I lean toward a bounce toward the upper red zone around 0.031–0.032. ✅
My base plan: look for a 4H bounce signal from the orange area (wick rejection and RSI curling up) to ride a long into that 0.031–0.032 pocket. If we lose the orange zone with a clean 4H close below ~0.0288, then I step aside and wait for entries in the green box near 0.027–0.028, where the next bigger demand sits. I might be wrong, but ignoring this support cluster here feels like fighting the chart. ⚠️
ONDO: bounce off the demand zone? key levels for todayONDO – dip or dead? RWA names are still in the spotlight, and according to the market, money keeps flowing into tokenized treasury products and on‑chain yield plays. After the latest headlines about bigger institutions testing tokenization rails, ONDO cooled off, but price is now parked on a key 4H demand zone again.
On the 4H chart we’re sitting right in the thick orange block around 0.25, which has acted as a heavy high‑volume node and launchpad several times. RSI is hanging just below mid‑range, showing cooled momentum but not full capitulation, so I’m leaning toward a bounce rather than a breakdown. As long as this box holds, I like the long side with first liquidity magnet around 0.26 and then the lower edge of the red supply zone near 0.27.
My plan: hunt longs inside the orange zone with a clear bullish 4H reaction ✅. Base case is a rotation back to 0.26‑0.27; if price closes below the green zone around 0.24, I assume support is gone and I’ll step aside, eyeing 0.23 next. I might be wrong, but until that breakdown happens, ONDO still looks like a classic buy‑the‑dip in a hot narrative.
XAUT: bullish consolidation? key levels and targets aheadMarket Cap XAUT – who said only memecoins moon? Gold-backed crypto has been getting fresh attention as traders hunt for safety while the market chops around, and according to industry sources, flows into gold products have been quietly picking up. We just saw a strong spike in XAUT cap and now the chart is catching its breath right under local highs.
On the 4H chart, price ripped off that green demand block and is now ranging around 2.88 with a mini flag forming. RSI has cooled back toward 50, so the steam is reset rather than dead. VPVR shows a fat support zone just below, while the path above 2.90 looks relatively thin - that’s where breakouts tend to run fast. I’m leaning bullish here.
My base plan: as long as we hold above the local support zone around 2.80, I’m eyeing a push toward the prior high near 3.0 and possibly a fresh extension after. Conservative play is waiting for a clean 4H close above the range high, aggressive play is dip-buying into the green box with a stop below it ✅. If that 2.80 - 2.77 area gives way, then the door opens for a deeper sweep into the lower demand block around 2.65 - 2.55 ⚠️. I might be wrong, but fading a healthy consolidation after a strong impulse has wrecked more traders than it saved.
PEPE: bounce or break? key levels for the next few daysPEPE
Is the frog getting ready to jump again or is this one more rug for meme hunters?
According to market chatter, meme coins have cooled off after the last hype burst, but PEPE keeps popping up in whale accumulation lists and liquidity pools are still pretty thick. On the 4H chart price is sitting right in a major demand block (that orange zone) where we bounced from before, while RSI is down in the 30s and curling up - classic "sold too hard, too fast" vibe.
My base case is a relief bounce from this box toward the next red supply areas above. If buyers defend this range and we see volume pick up on green candles, I’m eyeing a move first into the 0.00000039 area, then potentially 0.00000042 - 0.00000045. I might be wrong, but for me the setup is simple: ✅ long only inside this orange zone, invalidated if we get a clean 4H close below it, which opens the door for a deeper slide to the next support below. I’m waiting for a reaction wick and stronger volume before pulling the trigger.
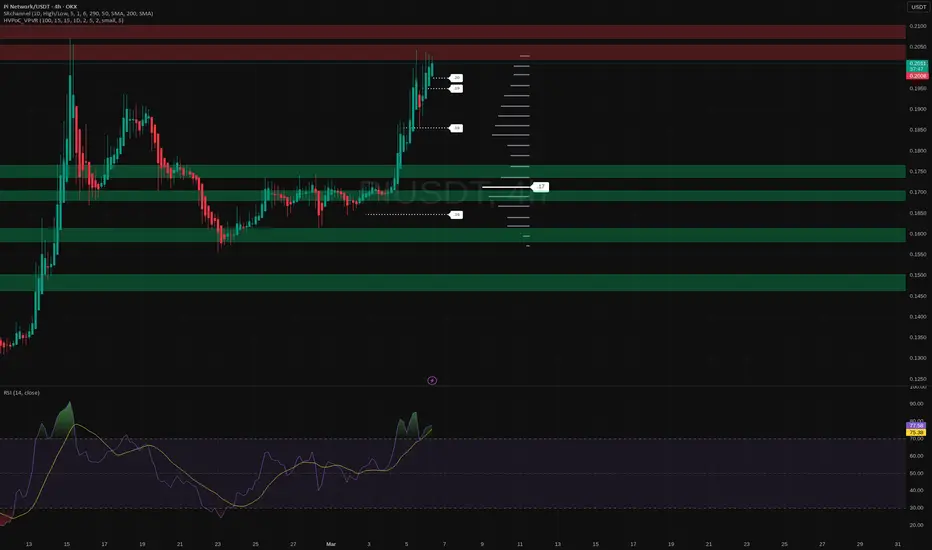
Pi Network: potential pullback or breakout? key levels to watchPi Network – who’s chasing this spike and who’s about to be exit liquidity? According to industry sources, fresh rumors around mainnet progress and new exchange interest hit the feed this week, and Pi ripped straight into a big supply pocket. Price has gone vertical, which is fun for screenshots, but usually not for late buyers.
On the 4H chart we’re trading right inside a heavy red resistance zone around 0.20, with RSI stretched in the high 70s. That combo screams “heat check” to me, so I’m leaning short term corrective rather than immediate moonshot. I might be wrong, but after moves like this the market usually needs to catch its breath before the next leg.
My base plan: I’m watching for rejection wicks and fading volume here, aiming for a pullback into the nearest green demand around 0.185 then 0.175 ✅. If price rips clean above the red box and holds above 0.21, that kills the pullback idea and opens space toward the upper liquidity ladder on the chart. For now I’m patient and waiting for confirmation instead of FOMOing into candles that already did the running ⚠️.
1:7 RR 14 pips stopReason for this setup fundamentally ?
Two words
Geopolitics
NFP
Then technically:
• Structure wise, price has shifted control to buyers
• DXY is bullish (no surprise there) - SMT Correlation
• Buys from this current demand zone should push prize to take the cument swing high (TP)
then 4 other conditions have been met.
Manage risk !!!
BGBUSDT: bargain zone or bounce? key levels to watch todayBGBUSDT – bargain zone or dead token bounce? Recently exchange tokens have been lagging majors while traders rotate back into BTC and regulators keep poking at centralized venues, according to industry chatter. At the same time, the project side keeps pushing campaigns and token support, so sentiment is bearish but not dead.
On the 4H chart, price flushed from the highs into a thick demand block (orange zone), basically the last strong consolidation area. RSI is making higher lows while price makes lower lows – classic bullish divergence – and the sell volume is getting absorbed around this floor. That combo makes me lean toward a relief move up rather than another straight leg down.
My base plan: look for longs inside 2.15–2.20 with targets near 2.45 and then 2.70 if momentum really kicks in ✅ A clean 4H close below 2.05 would kill the idea for me and open space toward 1.90, so that’s where my invalidation sits. I’m stalking wicks into the zone for entries; I might be wrong, but some of the best trades start exactly where the chart looks ugliest.
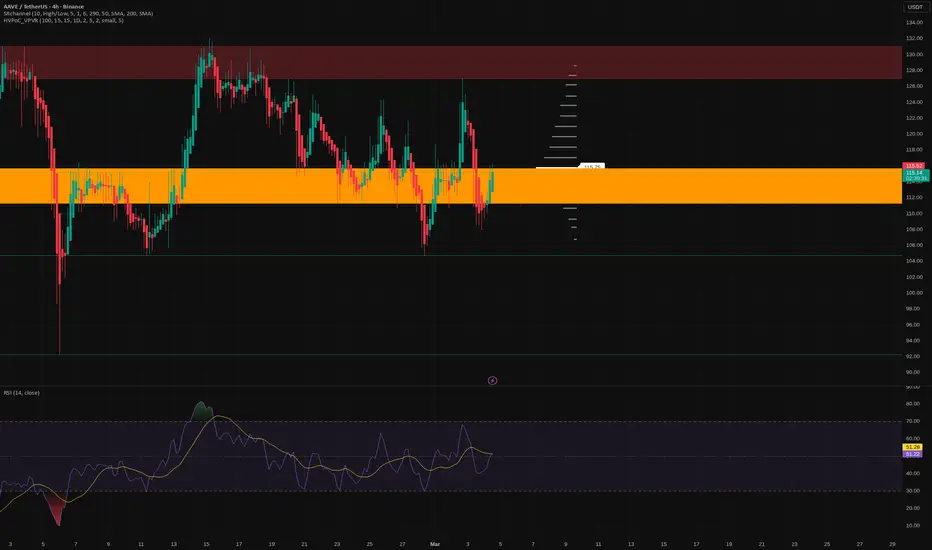
Aave: bounce or breakdown? key levels to watch todayAave. Watching this DeFi dinosaur come back to life or fakeout again? Recent headlines keep circling around renewed interest in lending protocols and fresh capital rotating from majors into DeFi, according to market chatter, so eyes are slowly drifting back to names like Aave. Price is reacting exactly at a big 4H demand block after that recent washout, so this zone matters right now.
On the 4H chart we’re holding the orange support area around 110-116 with RSI chilling near 50 - plenty of room either way. Volume by price shows a chunky node here, so as long as buyers defend this block I lean toward a push into the red supply band around 125-130. I might be wrong, but this still looks more like accumulation than distribution to me.
My game plan: ✅ hunt longs on dips into 112-114 with a clear bullish reaction, aiming first for 125 and then 130, with invalidation under 107. If 107 gives way on a 4H close, the idea flips and opens the door to the lower green levels near 100 and maybe 92 ⚠️. I’m patient here - no chase, just waiting for either the bounce from support or a clean breakdown to reframe the setup.
Bittensor (TAO): ready for a rebound? key levels to watchBittensor. Who’s trying to ride the next AI leg up instead of chasing tops again? According to market chatter, AI coins are back on everyone’s radar and TAO has been holding up better than most on pullbacks, so this 4H setup has my attention right now.
On the 4H chart price is bouncing inside a chunky demand block around 175‑185 after the last selloff, while the earlier supply sits up near 205‑215. RSI is curling up from the mid‑50s, not overheated, and volume isn’t screaming panic, which usually means sellers are running out of fuel. That combo makes me lean long from this zone, looking for a squeeze back into the red supply above.
My base case ✅ a grind higher toward 205‑215 as long as bulls defend the 172‑175 area on closing basis. If we get a clean 4H close below that box, I treat it as a failed bounce and expect a slide toward the next demand around 150. I’m stalking a long on a strong bullish 4H candle out of this range – and yeah, I might be wrong, but ignoring clear levels has cost me way more over the years.
NIFTY Testing the Lower Value Area of the Uptrend ChannelNifty Long-Term Update: As discussed earlier, NIFTY has revisited the demand zone below 24,500.This area previously acted as a key reaction point and may once again present an investment opportunity if price shows imbalance and buyers step in with strength.
value Area between 24000-24500
MNT: ready to ride? key levels and targets for todayMNTUSDT - still on your radar or already forgotten in the memecoin noise? According to industry desks, capital has been rotating back into L2 names and Mantle’s ecosystem metrics have quietly been ticking up again, so this one is getting fresh eyes. Price has been camping in the same 4H demand block for days - when a coin refuses to go lower while the story improves, I pay attention.
On the 4H chart, MNTUSDT is ranging inside a wide green zone roughly 0.60-0.67 with repeated bounces off the lower half and RSI grinding above 50. That looks more like accumulation than distribution, so I’m leaning long, looking for a clean break and hold above the 0.67 zone to open the door to the liquidity pocket around 0.72-0.75. I might be wrong, but fading this demand zone looks like trying to short a trampoline. ✅
My plan: hunt longs on dips back into 0.63-0.65 with a tight invalidation below the 0.60 floor, first target near 0.72 and then 0.75 if momentum really kicks in. If 0.60 gives way on a strong 4H close, the idea flips - that would turn the range into a failed base and expose 0.55-0.53 for the bears, where I’d rather stay flat or look for a short scalp.
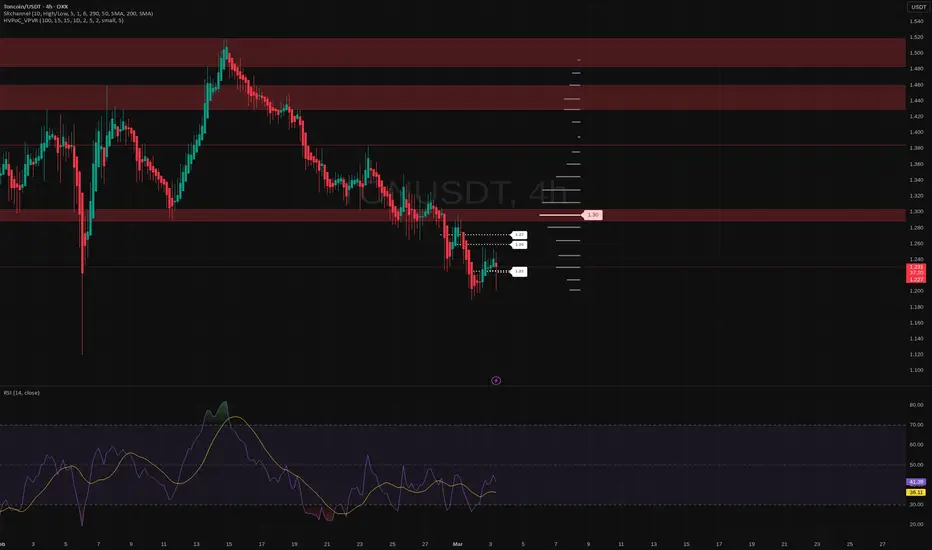
Toncoin: dip buying opportunity or falling knife? key levels to Toncoin - buying the dip or catching a falling knife here? Recently the project got a boost from news that channel owners on its main messenger partner will share ad revenue in TON, and later stablecoin support was rolled out, so on-chain activity has been heating up according to industry sources. Price, however, has cooled off hard after the hype spike and is now sitting back in an old demand pocket.
On the 4H chart, price is parked in the 1.18‑1.25 support zone where we saw strong volume before, while RSI has climbed out of oversold and is trying to build a higher low. That combo plus fading selling volume makes me lean toward a relief bounce rather than a fresh breakdown. I might be wrong, but shorting straight into this kind of demand looks like volunteering as liquidity.
My base case: hold above 1.18 and I’m looking for a push toward 1.30 first, then possibly the thicker supply band around 1.40‑1.45 ✅. If we get a clean 4H close below 1.18 with rising volume, that flips the script and opens room for 1.10 or even lower ⚠️. I’m waiting for a bullish 4H candle or reclaim of 1.24 to join the long side, otherwise I’ll step aside and let the breakdown play out.
WIF: breakout potential ahead? key levels to watch this weekWIF. Are you still fading this dog or riding with the hat crew? While majors keep chopping, memecoins are back on every watchlist and, according to market chatter, WIF is pulling in fresh speculative flows again. That’s why this 4H setup has my attention right now.
On the 4H chart price bounced cleanly from the green demand block around 0.10 and is now pressing into the red supply zone just above 0.11. RSI has cooled down into the mid range, so we’ve got room for another leg if buyers flip this resistance. I’m leaning long - a proper 4H close above the current red box could unlock a squeeze toward the next supply area around 0.125 and then the prior wick highs higher up.
My play: I’m interested in longs only if we reclaim and hold above that 0.11 region, with invalidation below the recent swing low and demand near 0.10 ✅. Base case - breakout and continuation to mid 0.12s+, but if price gets smacked back inside the range and loses the green zone, I’ll step aside and look for bids much lower. I might be wrong, but to me this looks less like a dead meme and more like a coiled spring.