Long
Long
Bitcoin Cycle Location: Old Cycle Top as SupportThis is not a shortterm trade idea.ıtis a cycle location framework.
The key point of this chart is simple Bitcoin is not only correcting from the 2025 high. It is testing one of the most important structural zones of the entire cycle.
The 2021 cycle top area, roughly the 58K–69K zone, was the ceiling of the previous cycle. After Bitcoin reclaimed that area in 2024, the market entered a different structural regime. The old cycle top stopped being only historical resistance and started acting as a potential support zone for the next cycle.
That is what is being tested now.
Many people are still looking for a completely new bottom, but the market may already be testing the most important bottom structure in plain sight: the old cycle top as new support.
This is why I do not treat the current zone as random noise. Bitcoin is sitting near the old cycletop support area while compressing inside a descending structure from the 2025 high. This creates a clear cycle location question:
Is this a failed cycle and the beginning of deeper structural damage?
Or is this a reset above the previous cycle ceiling before the next expansion phase?
The answer is not confirmed yet. For the bullish cycle location thesis to strengthen, Bitcoin needs to hold the old cycletop zone and break out of the descending corrective structure. A clean reclaim above the downtrend would suggest that the market is no longer only correcting. It would suggest that the old ceiling is successfully behaving like a new floor.
That would be important. In previous cycles, major expansions often began after the market tested levels that felt uncomfortable in real time. The crowd usually wants a perfect bottom, clear confirmation, no fear and no risk. Markets rarely give that. They often give a structural zone that looks weak before the next move becomes obvious.
This is exactly why the current area matters.
The invalidation is also clear. If Bitcoin loses the old cycle top zone and fails to reclaim it, the cycle location thesis weakenss. A sustained breakdown below this support area would suggest that the market is not defending the previous cycle ceiling as a new floor. Until that happens, this remains a structural support test. Not a guarantee. Not confirmation. But an important cycle location setup.
The old cycle top is now the support zone.
If it holds and the downtrend breaks, the market may not be giving the crowd a new bottom.
It may be leaving them behind at the retest.  Long
Long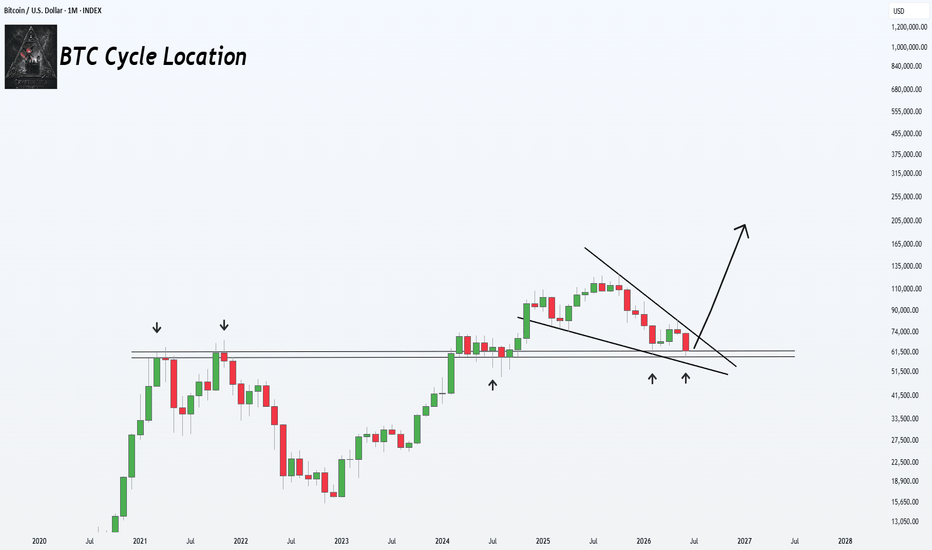
EURUSD – The Fractal Geometry of the Grand SupercycleIn navigating the current complexity of the EURUSD structure, the divide between our “Aggressive” and “Conservative” scenarios boils down to a question of fractal resolution.
The Aggressive Outlook: We are currently evaluating the potential for an extended Double Zigzag. Should the initial wave indeed manifest as a Leading Diagonal, we must strictly adhere to the internal 5-wave structure of Wave A. We are currently observing the corrective phase with precision, ensuring the integrity of the Wave 2 origin remains intact.
The Conservative Outlook: Our perspective shifts toward a broader Double (or even Triple) Zigzag, suggesting that the impulsive move we anticipate is still in its formative, preparatory stage. The market is currently signaling a transition phase where the alignment between macro-fundamentals and wave mechanics is, quite remarkably, converging.
Technical Markers & Risk Management:
Invalidation Point: We are monitoring the origin of Wave 2 with rigorous discipline. A breach at this level invalidates our current Leading Diagonal interpretation, forcing an immediate, objective structural reassessment.
Impulse Trigger: Keep a laser focus on the corrective channels mapped on the chart. A definitive breach of these channels serves as the “green light” for the next major impulsive leg.
Technical Discipline: Whether we are dealing with a Double or Triple Zigzag, market geometry remains our North Star. If the price action fails to conform to Fibonacci guidelines and wave-degree requirements, we do not force the trade.
Closing Thought: Many market participants dismiss Elliott Wave theory, primarily because it demands immense patience and technical discipline. However, for those of us who follow these patterns, we know the truth: the market never lies; it merely hides its intent in plain sight. The truth of the market is etched within the waves, not in the noise of the headlines.
Euro / U.S. Dollar
Feb 6, 2025
EUR/USD – Bullish Wave & Invalidation Zone
British Pound / U.S. Dollar
Feb 6, 2025
GBP/USD Elliott Wave Analysis – Major Breakout Ahead?
Short 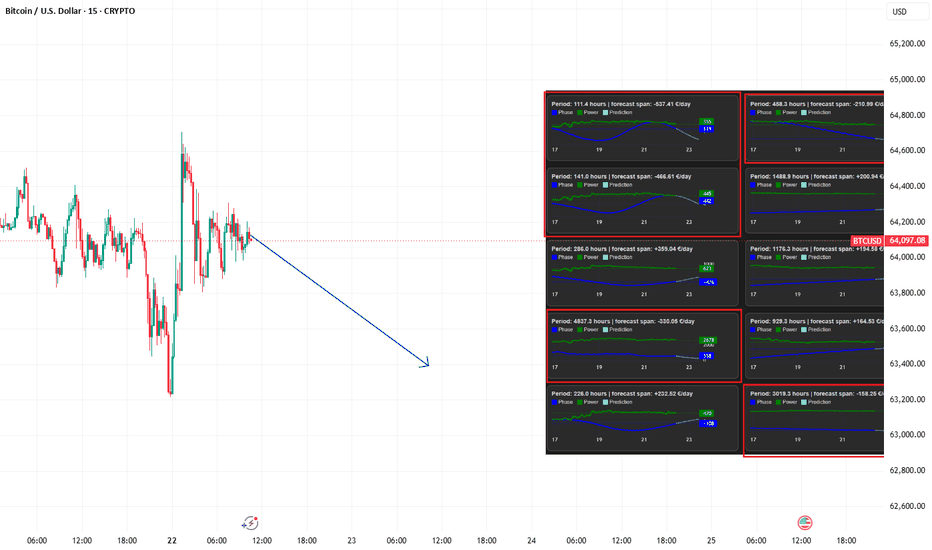
 Short
Short
EURUSD: Grand Supercycle Perspective & Structural OutlookOverview:
Analyzing the EURUSD on a monthly timeframe requires a macro-structural approach. The key focus remains on the interpretation of the price action post-2008 (the cycle peak), whether it defines an Impulsive decline or a complex Corrective structure.
Scenario 1: The Aggressive View (Impulsive Count)
Structure: This count interprets the decline from the 2008 peak as an Impulsive move (5-wave structure).
Current Phase: The market has completed the first three sub-waves. We are currently positioned within the corrective phase of this structure.
Expectation: The structure suggests a continued decline to complete the remaining two sub-waves, potentially leading to a deep, prolonged correction on a grand scale. The flexibility here allows for Simple, Double, or Triple Zigzags within the corrective sequences.
Scenario 2: The Conservative View (Double Zigzag / 7-Swing)
Structure: This view prioritizes the Double Zigzag interpretation, treating the complex corrective patterns as a consolidation rather than a direct impulse.
Current Phase: The analysis points toward a 7-swing configuration. We are currently tracking the final leg of this structure.
Expectation: One additional downward leg is anticipated to complete the primary Wave A of the Grand Supercycle. Once this is finalized, the market would enter a massive, long-term corrective phase—a process that spans decades.
Trader’s Note:
The structural divergence hinges on the market’s internal response to the current corrective levels. While the “Aggressive” path anticipates an accelerated impulsive termination, the “Conservative” path allows for a final swing to cement the historical Wave A. Regardless of the outcome, we are witnessing the formation of a structural epoch.
Euro / U.S. Dollar
Jul 21, 2022
The euro continues its last downward move against the US dollar
Euro / U.S. Dollar
Jul 25, 2022
The euro is in an upward trend, which is the term for a downward
Euro / U.S. Dollar
Jan 15, 2023
Is the EUR/USD forming a correction pattern?
Euro / U.S. Dollar
Feb 6, 2025
EUR/USD – Bullish Wave & Invalidation Zone
THE COMPLETE STORY OF BITCOIN CRASHESTo understand Bitcoin, you cannot only look at today’s price. You have to look at the entire story. This is not a nostalgia thread. This is a media psychology archive.
What did mainstream media write during every major Bitcoin crash?
What did people believe?
What did Bitcoin critics say?
What fear did the crowd surrender to?
And where did the courageous decision appear?
Because bottoms are not built only by price. Bottoms are built by fear. And nobody sells fear better than mainstream media.
If you say: “I only care about the market after I entered. The past does not matter.”
Then you are already on the losing side. This is one of the biggest mistakes new investors make. They think their entry date is the beginning of market history.
People who entered in 2021 think 2021 is the center of everything.
People who entered after the ETF era think this market is completely new.
People watching the 2026 panic think this fear is unique. Then they repeat the same sentence:
“This time is different.”
No. It is not.
The price is different.
The year is different.
The players are different.
The headlines are different.
But human psychology is the same. At the bottom, people always do the same thing: They panic. They believe the headlines. They hide inside the crowd. Then when the market turns, they say: “I wish I bought there.”
Let me be blunt:
Mainstream media is the motherfucker in this game.
At the top, it sells comfort. At the bottom, it sells panic. It does not give the crowd independent thought. It packages emotion as reality.
This thread follows the yellow zones on the chart. They are not only price zones. They are psychological zones.
2011:
Hack.
Silk Road.
Crime.
Bubble.
2015:
Failed experiment.
Bitcoin is dead.
The technology may not survive.
2018:
Crypto bubble.
ICO collapse.
Dot-com comparison.
Retail destruction.
2020:
COVID CRASH
Bitcoin is not a safe haven.
Digital gold failed.
Everything is being sold.
2022:
Terra, Celsius, FTX.
Fraud.
Contagion.
Bank run.
2026:
Trump rally erased.
ETF could not save it.
Digital gold confidence broken.
Crypto winter is back.
The words changed.
The mechanism did not.
Price fell. Media packaged fear. The crowd surrendered. Critics took a victory lap.Then the market continued according to structure.
2011 -THEY SAID THE INTERNET MONEY WAS DEAD
June 2011 – November 2011.
Bitcoin was not a macro asset yet.
No ETFs.
No institutional desks.
No Bitcoin treasury companies.
No daily CNBC coverage.
No global fund strategies.
To mainstream media, Bitcoin was experimental, strange, dangerous, and difficult to understand.
Then the first major crash arrived.
Bitcoin fell from roughly the $31–33 area to around $2.
The headlines were brutal:
The Economist:
“The bursting of the Bitcoin bubble”
Wired:
“Bitcoin Prices Plummet on Hacked Exchange”
Forbes:
“So, That’s the End of Bitcoin Then”
Wired / Gawker narrative:
“Underground Website Lets You Buy Any Drug Imaginable”
Wired:
“The Rise and Fall of Bitcoin”
Mt. Gox was critical here.
After a user account was compromised, the price on the exchange collapsed from around $17 to a few cents. Trading was halted. Rollback was discussed. User data leaked. Technically, this was more about Mt. Gox than the Bitcoin protocol. But the public did not read it that way. The public heard: “Bitcoin was hacked.” That is how mainstream media works. It removes the distinction. It deletes the details. It turns a complex reality into a simple fear. Then it converts that fear into a headline.
Exchange crisis?
No.
“Bitcoin hacked.”
Liquidity issue?
No.
“Bitcoin bubble burst.”
Early experimental technology?
No.
“Crime money.”
The 2011 lesson was simple:
Bitcoin was not dead. It was going through its first major fear test. And the people who failed were the usual ones: Those who followed headlines. Those who hid inside the crowd. Those who confused fear with data. Those who believed mainstream media’s packaged panic was reality.
2015 -THEY SAID THE BITCOIN EXPERIMENT FAILED
January 2015. This time, the story was not only about hacks.
The narrative became heavier: What if Bitcoin was a failed experiment? Bitcoin had reached around $1,200 in late 2013. Then came a long, exhausting bear market. By early 2015, price was near the $200 area.
The market was quiet.
Attention was gone.
Belief was broken.
New buyers disappeared.
Old holders were tired. then mainstream media returned.
The headlines:
Business Insider:
“Bitcoin Is Getting Annihilated”
The Guardian:
“Bitcoin price plunge sparks new crash fears”
Wired:
“Bitcoin value plummets below $200”
Time:
“Bitcoin Continues to Plummet”
The Telegraph:
“Bitcoin might be dead. It doesn’t matter.”
In 2011, the fear was:
Hack.
Silk Road.
Crime.
Bubble.
In 2015, the fear changed:
Bitcoin may be a failed experiment.
Price collapsed, so confidence must be gone.
Mining economics may break. Regulation may kill growth. Adoption may not arrive. The technology may survive, but the coin may die. In 2015, media linked price decline directly to idea death. Price fell.
Therefore, the idea failed.
This is one of the crowd’s biggest weaknesses.
The crowd confuses price with truth.
When price rises, they think the idea is genius.
When price falls, they think the technology is dead.
Mainstream media understands this.
At the bottom, it shows you price and says:
“Confidence is gone.”
At the top, it shows you price and says:
“Institutional adoption is here.”
Same trick. Different phase.
The 2015 lesson:
Price can fall.
Narrative can break.
Belief can disappear.
People can get exhausted.
Media can write the obituary
Critics can celebrate.
But if the structure is not dead, the cycle is not over. Bitcoin did not die. It buried the patience of the crowd.
2018 THEY SAID THE BUBBLE FINALLY BURST
November 2018 – December 2018.
This was the real capitulation after the 2017 ICO and altcoin mania. I entered the market before that bull market, so 2017-2018 was not just a chart for me. It was lived experience.
This time, Bitcoin was not alone.
Altcoins were everywhere.
ICOs were everywhere.
BitConnect happened.
Every day, some new garbage was sold as “the future of technology.” Everyone held a coin that was supposed to become the next Ethereum. Then everything collapsed together.
The headlines:
Reuters:
“Bitcoin crashes to lowest this year, losses top 25 percent in a week”
Bloomberg:
“Crypto’s 80% Plunge Is Now Worse Than the Dot-Com Crash”
The Guardian:
“Bitcoin biggest bubble in history, says economist who predicted 2008 crash”
Business Insider / Roubini:
“The Mother Of All Bubbles And Biggest Bubble in Human History Comes Down Crashing”
CBS / CNN line:
“Bitcoin Crash: This Man Lost His Savings When Cryptocurrencies Plunged”
In 2018, media did not frame Bitcoin alone. It framed Bitcoin as the symbol of the entire crypto bubble. dot. com comparison arrived. Roubini called it the “mother of all bubbles.” Retail loss stories moved to television.
psychology was clear:
“We thought we would get rich in 2017.”
“Altcoins are dead.”
“ICOs were scams.”
“Even Bitcoin does not feel safe.”
“I will nver come back to crypto.”
This time, the dominant narrative was not only:
“Bitcoin is dead.”
It was:
“The entire crypto industry is a scam.” And yes, part of that criticism was justified.
Many ICOs were garbage.
BitConnect was a disaster.
Retail was burned.
The market was full of trash. But mainstream media did what it always does: It showed the trash and buried the entire structure with it.
It takes one rotten part. It applies it to the whole system. Then it sells that as the final judgment.
2018’s lesson:
A market can be full of garbage. But when mainstream media uses that garbage to bury the structures that will survive, it is not analysis. It is fear distribution. The crowd saw what was dying and assumed everything was dead. That was the mistake.
2020 -THEY SAID YOU DO NOT BUY BITCOIN DURING A FIRE
March 12–13, 2020. (covid crash)
This was not a normal Bitcoin bear market. This was a global liquidity fire. The world was shutting down.
People did not know how far the pandemic would go.
Would economies close?
Would jobs disappear?
Would banks function normally?
Would markets break?
Nobody knew.
The headlines:
Reuters:
“Bitcoin plummets as cryptocurrencies suffer in market turmoil”
Forbes:
“The Real Reason Behind Bitcoin And Crypto’s $50 Billion Crash”
Nasdaq:
“COVID-19 Outbreak Revealed Bitcoin’s Broken Infrastructure”
Academic literature:
“Safe haven or risky hazard? Bitcoin during the Covid-19 bear market”
The 2020 narrative was:
Bitcoin is not a safe haven. Bitcoin trades like a risk asset. In a liquidity crisis, everyone runs to cash. Crypto infrastructure failed the stress test. Digital gold failed. This bottom was different.
The strongest anti Bitcoin argument was not:
“Bitcoin will go to zero.”
It was:
“Bitcoin is not a safe haven.”
And from a short-term price behavior perspective, that sentence was not completely absurd. Yes, Bitcoin did not protect investors during that exact moment. But that was not the point. The correct move was not to repeat the headline and stay away from Bitcoin. The rational move was to be able to buy Bitcoin near $3,900. Easy on the chart. Brutal in real time.
Because everyone was saying:
Bitcoin is not a safe haven.
Bitcoin failed during crisis.
Bitcoin is just another risk asset.
Bitcoin is dead.
Are you stupid?
Why would you buy Bitcoin now?
Some of the largest personal gains I have ever made came from the purchases I made during that period. It was not easy. But it was extremely profitable. tthat is how this game works. At that time, many people called me stupid for buying Bitcoin while the world was panicking. People looked at me like I was an idiot. When I said “buy Bitcoin,” I could see the sentence on their faces: “You are a complete moron.” Then the same people came after $40,000. Some came above $60,000. And asked: “Should we buy Bitcoin?”This is the cruelty of markets. At the bottom, everyone becomes a theorist.
Everyone explains risk. everyone gives fear an intellectual costume. Everyone talks with the mouth of mainstream media. But money does not go to the person writing poetry about the fire. It goes to the person who sees the fire and makes the right decision.
This is where Umberto Eco’s idea matters:
“When a theater is on fire, the intellectual’s first duty is to call the fire brigade.” That is enough.
The meaning is clear: When the theater is burning, you do not walk on stage and give a speech about fire.
You do not write poetry about fire. You do not debate the conceptual framework of fire. You act. 2020 was exactly that. The theater was on fire. Mainstream media was writing poems about the fire.
Critics were screaming: “Bitcoin is not a safe haven.”The crowd ran to cash. People could not think because fear had locked their nervous system. But the job was not to write poetry. The job was to see the fire.
See the panic See the price. And make a decision.
The 2020 lesson:
In a crisis, mainstream media does not teach you how to think. It teaches you how to fear. The crowd then mistakes that fear for intelligence.
2022 - THEY SAID THE SYSTEM WAS ROTTEN FROM THE INSIDE
May 2022 – November 2022.
This was not one event. First came Terra / Luna. Then Celsius. Then 3AC. Then FTX.
The narrative changed again.
2011 was about hacks.
2015 was about a failed experiment.
2018 was about a bubble.
2020 was about the failure of the safe-haven narrative.
2022 was about systemic rot.
The headlines:
Reuters:
“Bitcoin slides below $20,000 to lowest level in 18 months”
Reuters:
“Crypto exchange FTX saw $6 billion in withdrawals in 72 hours”
The Guardian:
“Binance pulls out of FTX merger, sending cryptocurrency prices plunging”
Time:
“Cryto Is Crashing. This Time, Blame FTX and Sam Bankman-Fried”
CNBC:
“The Collapse Of FTX: Insiders Tell All”
The 2022 media language was:
Crypto contagion.
Exchange risk.
Fraud.
Bank run.
Not your keys, not your coins
Lehman moment.
Crypto winter.
Retail psychology was heavier than 2018. In 2018, many people thought:
“I bought the wrong coin.”
In 2022, people thought:
“I cannot withdraw my money.”
“I trusted the exchange.”
“I thought stablecoins were safe.”
“I thought yield platforms were low risk.”
“If even FTX was not safe, then who is safe?”
That was the difference.
2018 said:
“The bubble burst.”
2022 said:
“The system burned people from the inside.”
That fear is deeper. You can survive price decline. But when trust infrastructure collapses, the investor’s relationship with the market breaks. By 2022, the “Bitcoin is dead” narrative was not as easy to sell anymore. People knew Bitcoin had already died many times and returned. So the story changed.
It was no longer:
“Bitcoin will disappear.”
It became:
“The whole crypto system is rotten.”
And most people believed something else: 9k–12k is coming.
They did not want to take the 15k reversal seriously.
At the top, everyone waits for higher targets.
At the bottom, everyone waits for lower targets.
Because humans do not follow price.
They follow emotion.
The lesson:
Opportunity zones often appear when the crisis is at maximum intensity. If everything feels comfortable, relaxed, and bullish, you are probably not in a max opportunity / low risk zone.
“Buy when there’s blood in the streets, even if the blood is your own.” That is exactly it. Buying when there is blood in the streets is not easy. Because some of that blood is yours.
2026 THEY SAID EVEN POLITICAL SUPPORT WAS NOT ENOUGH
February 2026 – June 2026.
First, let’s be precise:
I am not saying the 2026 historical bottom is confirmed.
This is the current panic zone / potential bottom zone.
But the media narrative is already clear.
Trump rally erased.
ETFs could not protect it.
Digital gold confidence weakened.
Crypto winter returned. Political support was not enough. Bitcoin is trading like a risk on tech asset.
The headlines and narratives:
Financial Times:
Bitcoin erased the Trump rally.
The Guardian:
Bitcoin lost roughly half its value in three months.
Reuters:
Trillions were wiped from the crypto market.
Al Jazeera:
Why is Bitcoin crashing despite Trump’s support?
Bloomberg TV:
“Is Crypto’s Historic Run Over?”
“Crypto Winter Rolls On”
The 2026 investor psychology: Trump supported it, but price still fell. ETFs existed, but they did not protect the market. Why is digital gold not acting like gold? Where are the institutional buyers? What happens to Strategy and Bitcoin treasury companies?
Does it go below $60,000?
The critic language became more philosophical:
Political power cannot save crypto.
The crypto cult is breaking.
Bitcoin has no real fundamentals.
This is a crisis of faith.
Bitcoin can go back to $10,000. So again, the same thing happens. Price falls. People think the narrative is broken. No. The Bitcoin narrative is not what is damaged. Your emotions are.
2011:
They said hack.
2015:
They said failed experiment.
2018:
They said bubble.
2020:
They said not a safe haven.
2022:
They said fraud and Ponzi.
2026:
They say even political support was not enough.
Every cycle changes the vocabulary. The mechanism stays the same.But the lesson is not:
“Bitcoin always goes up after every crash, so just buy.”
No. That is too stupid. Every fear is not a buying opportunity. Every decline is not a bottom. Every crisis does not lead to recovery. Not every asset survives.
The real lesson is this:
Mainstream media is usually on the wrong side of the critical cycle points. At the top, it manufactures confidenceAt the bottom, it manufactures fear. crowd mistakes that manufactured emotion for reality. That is why market courage is not random risk taking.
Courage is being able to ask:
Is this fear natural? Or is this fear being produced, packaged, and sold to me? Courage is rejecting the emotion mainstream media is selling and looking at:
data,
history,
structure,
cycle location,
confirmation,
invalidation.
Courage is not writing poetry when the theater is on fire. Courage is doing what has to be done.
They say the Bitcoin narrative is damaged.
No.
Your emotions are damaged.
system knows this. And it uses it.Start from the beginning:
What is a market?
How does it work?
Where do people buy?
Where do people sell?
How does money transfer from one group to another?
Every day, markets and media produce noise to make you forget these basic questions. Bitcoin is not exempt. The price changes. The year changes. The people change. The institutions change. The headlines change. But psychology does not.
Bottoms come with:
collapse,
death,
fraud,
fear,
contagion,
broken confidence,
system failure.
Tops come with:
comfort,
big targets,
easy money,
institutional adoption,
this time is different stories.
Mainstream medias job is not to make you independent. Its job is to scare you, manipulate you, and keep you emotionally aligned with the crowd. Mainstream media does not give you the map It gives you the mood. At the top, it sells comfort. At the bottom, it sells panic. If you trade based on mainstream media, you will get nothing. If you want to win, you must understand not what the crowd feels. You must understand what the crowd is being made to feel. The crowd does not lose at the bottom because it is stupid. The crowd loses because it is the crowd. The crowd wants comfort. But real opportunity is not born in comfort.
It appears when: headlines are bleeding, everyone is waiting for lower targets, critics are celebrating, and media sells fear as reality.That is why people search for the secret and never find it. Because they are not looking carefully. They do not want the secret. They want to be deceived. The chart shows price. headlines show psychology.
But the winner is decided somewhere else:
Who surrendered when fear was produced?
Who thought clearly?
Who remembered history?
Who read the structure?
Who stopped writing poetry during the fire and made a decision?
The market eventually rewards that.
Not noise. Not comfort. Not the crowd. Courage.
This is not a price prediction. It is a media psychology archive of Bitcoin crash zones.
BITCOIN BOTTOMS ARE WRITTEN IN FEAR ! Education 
XAGUSD: Detailed Technical AnalysisScenario 1: Aggressive (Turquoise Count)
Core Hypothesis: The price action indicates the completion of Wave A as a Leading Diagonal. This implies that the subsequent market behavior should unfold as a corrective structure.
Current Stage: The analysis suggests that the market is presently engaged in the formation of Wave B, which represents the initial corrective leg following the diagonal impulse. This phase is characterized by its corrective nature, typically unfolding in a three-wave pattern (A-B-C).
Projected Path: Following the completion of the current Wave B, a further downside movement is anticipated. This decline is expected to constitute Wave C, thereby completing a textbook Zigzag pattern for Wave 4 of the larger structure.
Key Rationale: This scenario posits that the Leading Diagonal is the terminal impulse wave (Wave A) of a larger move, and the subsequent price action will be a retracement. Therefore, Wave Y is explicitly excluded from this aggressive projection.
In Summary: The aggressive count posits a completed Leading Diagonal as Wave A, followed by a corrective Wave B, and an anticipated final decline to complete the Zigzag correction (Wave C).
Scenario 2: Conservative (Black/Gray Count)
Core Hypothesis: This count aligns with a Double Zigzag structure, indicating a more complex corrective sequence.
Current Stage: The prevailing assumption is that the first corrective wave, Wave (W), has already been fully formed. The market is now navigating through the subsequent corrective phase, Wave (X).
Projected Path: This scenario anticipates a potential extension or completion of Wave (X), possibly involving further consolidation or a minor retracement. Subsequently, a second Zigzag pattern is expected to unfold as Wave (Y), thereby concluding the overarching Double Zigzag.
Key Rationale: The conservative approach accounts for deeper and more prolonged corrections. The Double Zigzag provides a framework for such extended corrective sequences, allowing for complexity before the larger trend resumes.
In Summary: The conservative count interprets the current market behavior as part of a Double Zigzag, where Wave (W) is complete, and the market is in the process of forming Wave (X) before the final Zigzag decline for Wave (Y).
Conclusion
The divergence between these two scenarios hinges on the nature of the initial impulse and the subsequent corrective structure. The Leading Diagonal hypothesis (Aggressive) suggests a simpler correction is pending, while the Double Zigzag (Conservative) anticipates a more complex, multi-stage correction.
 Long
Long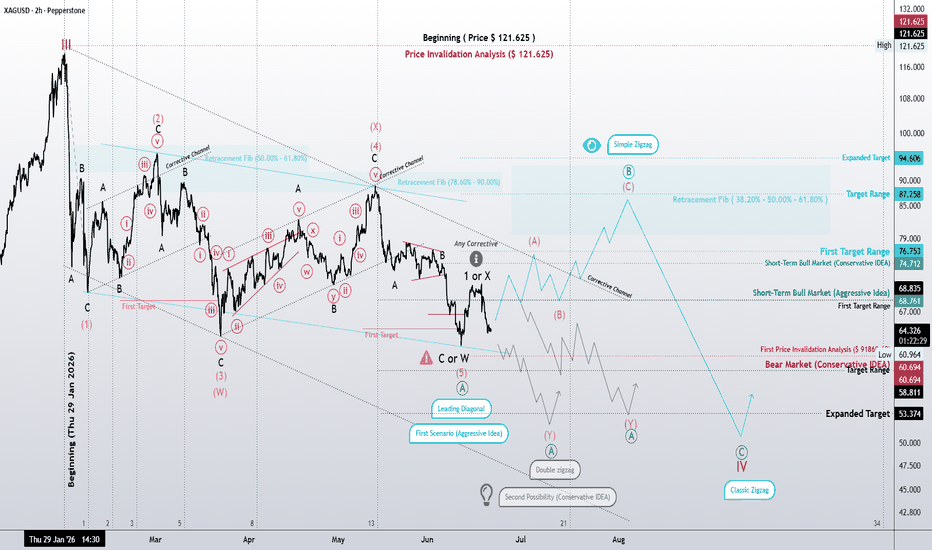
 Long
Long
BTC 1H: Two Windows of OpportunityThe chart shows one of the mirror patterns I use.
Currently, the model projects two windows of opportunity:
🟨 Window 1
June 9, 2026
7:48 AM – 10:12 PM
🟨 Window 2
June 10, 2026
12:00 PM – 9:00 PM (approx.)
As always, the time window alone does not indicate direction. The interesting thing is to observe how the price reacts if it reaches any of the pivot price levels during those time intervals.
Resistance/Upper Levels
• 68,000 – 67,400
• 67,000 – 66,300
• 64,400
• 63,100 – 62,900 ⭐️ (especially relevant area)
Support/Lower Levels
• 61,900
• 60,800
• 58,600
Scenarios to Watch:
📈 If the 66k zone is decisively broken, the next price magnet is located near 67k.
📉 If the market breaks below the 57,900 zone, a relative gap in support appears, and the downward acceleration could extend toward 56,500.
The important thing now is not to predict the exact path, but to observe how time and price interact when the market enters these windows.
As mentioned earlier, today (June 9th) marks a significant cyclical cluster.
Furthermore, this date is reinforced by Fibonacci projections across multiple timeframes, increasing the likelihood of a structural move.
Over the next 24 hours, I expect the market to break out of the range established on June 7th and begin a directional move toward the next significant cluster during the week of June 15th.
Depending on how the momentum develops, this move could extend until June 15th or 16th, or even June 20th.
As always, timing is key to knowing when to pay attention, and price action dictates how to trade. Key Timings and levels for BTC (Short-term!)In addition to June hosting a notable concentration of cyclical activity, the cycle clusters suggest that this week may act as an important inflection point for the market.
Within the week, two dates stand out due to their elevated concentration of cycles and, therefore, their potential to create trading opportunities:
17/06/2026
20/06/2026
⏰ Key timing windows for June 17
05:00 UTC-4
13:00 UTC-4
17:00 UTC-4
These hours may coincide with changes in direction, momentum shifts, breakouts, or increases in volatility.
🎯 Key Levels
The most significant levels are marked with ***:
72,900 ***
71,900 ***
68,000
67,600
64,400
63,100 ***
62,300
61,900
60,800
The chart highlights a potential ascending arc that has so far been acting as dynamic support. Based on this structure, two primary scenarios can be considered:
1️⃣ Bullish scenario
As long as price remains within the arc, it may continue producing successive breakouts as it advances toward the steeper portion of the structure.
2️⃣ Corrective scenario
If price breaks below the support defined by the arc, a move toward lower support levels becomes more likely. However, this would not invalidate the underlying time geometry of the model. The dates and hours identified above would still remain potential points of reversal, acceleration, or increased volatility.
As always, these timing windows should be used alongside price action and market structure to build scenarios and manage risk.  Long
Long