XAUUSD 4H: 5 Wins, 2 Losses โ Potential Bullish trendGold has experienced a significant bearish move over the past few weeks, but recent price action is showing a strong recovery from the lows.
Price has now rallied sharply toward the 200 EMA, suggesting a possible shift in market momentum and the beginning of a potential bullish trend reversal.
Using Ryan-Trend Pulse on the 4-hour timeframe, the strategy recorded encouraging results.
๐ Performance Snapshot
โ
Winning trades: 5
โ Losing trades: 2
๐ Total trades: 7
โ๏ธ Trading Strategy
Exponential Moving Average (EMA)
The Top 4 Lessons Of Forex Trading๐ฅ Reading Between the Charts: A Bullish
Clue Hiding in the Monthly Candles
Sometimes the best trading opportunities
don't announce themselves loudly.
You have to know where to look!
Let's take a closer look at an
interesting market situation
using a combination of the
13 EMA, Stochastic Oscillator and
Japanese Candlestick Patterns.
1. The Weekly Chart: Is Momentum Preparing for a Turn?
Start by looking at the weekly timeframe.
Notice three important things:
Price is trading above
AUDUSD 1H: 9 Wins, 3 Losses โ Following the TrendAUDUSD has shown an interesting transition over the past two weeks. After a strong bearish move, the market found support, recovered, and eventually broke above the 200 EMA, indicating a potential shift toward bullish momentum.
Using Ryan-Trend Pulse on the 1-hour timeframe, the strategy recorded some encouraging results.
๐ Performance Snapshot
โ
Winning trades: 9
โ Losing trades: 3
๐ Total trades: 12
โ๏ธ Trading Strategy
1. 200 EMA โ Trend Confirmation
Long: Look for buying oppor
AUDUSD 4H: Trend Reversal โ 4 Wins, 1 LossAUDUSD has been showing an interesting market transition on the 4-hour timeframe. After a sustained bearish move, price began recovering and broke above the 200 EMA, signaling a potential shift toward bullish momentum.
Using Ryan-Trend Pulse Pro, this setup delivered 4 winning trades and 1 losing trade during the period shown.
๐ Performance Snapshot
โ
Winning trades: 4
โ Losing trades: 1
๐ Total trades: 5
โ๏ธ The Strategy
1. 200 EMA โ Identify the Trend
๐ด Below the 200 EMA: Focus
Datadog (DDOG) โ Strong Growth, but Is the Valuation Justified?Datadog is a leading cloud observability and security platform, benefiting from the structural growth of cloud computing, artificial intelligence, and increasingly complex IT infrastructure.
However, a strong business does not necessarily make a stock an attractive investment at any price.
1. BUSINESS MODEL AND COMPETITIVE ADVANTAGES
Datadog provides a unified platform covering infrastructure monitoring, application performance monitoring (APM), log management, cloud security, and digital exp
AUDUSD 15M: 15 Trades, 11 Wins โ Ryan-Trend Pulse I've been testing Ryan-Trend Pulse on AUDUSD using the 15-minute timeframe, combining indicator signals with the 200 EMA trend filter.
The results so far:
๐ Performance Snapshot
โ
Winning trades: 11
โ Losing trades: 4
๐ Total trades: 15
โ๏ธ The Strategy
1. 200 EMA โ Identify the Trend
๐ข Long: Price breaks above the 200 EMA.
๐ด Short: Price breaks below the 200 EMA.
2. Ryan-Trend Pulse โ Confirm the Entry
Wait for the first valid indicator signal after the EMA breakout, ideally
USDCHF 15M: Capturing the Bullish Move with Ryan-Trend PulseUSDCHF delivered a strong bullish move after breaking above the 200 EMA, creating a profitable long opportunity before the market eventually reversed and pulled back.
๐ 1. Trend Confirmation โ 200 EMA
Price broke above the 200 EMA, shifting the short-term market bias from bearish to bullish. The rising EMA provided additional confirmation of the developing uptrend.
๐ข 2. Ryan-Trend Pulse Entry
After identifying the bullish direction, Ryan-Trend Pulse provided a structured long setup aroun
XAUUSD 15M: Catching the Gold Rally with Ryan-Trend PulseGold provided a strong bullish opportunity after breaking above the 200 EMA, followed by a powerful upward move. This setup demonstrates how Ryan-Trend Pulse can help identify trend-following entries with predefined trade levels.
๐ 1. Identify the Trend โ 200 EMA
Price moved above the 200 EMA, shifting the market bias toward bullish momentum. Instead of entering immediately, we waited for confirmation from Ryan-Trend Pulse.
๐ข 2. Ryan-Trend Pulse Entry
The indicator provided a long setup
EURUSD 15M: From Uptrend to Downtrend with Ryan-Trend PulseEURUSD provided an example of market transition from an uptrend to a downtrend , creating profitable opportunities in both directions using the same strategy.
The key is not to predict the reversal โ it's to wait for the 200 EMA breakout and Ryan-Trend Pulse confirmation .
๐ The Strategy
1. 200 EMA โ Determine Market Direction
The 200 EMA acts as the primary trend filter:
๐ข Long: Price breaks above the 200 EMA
๐ด Short: Price breaks below the 200 EMA
2. Ryan-Trend Pulse โ Confirm the
$BTC BULLS ARE IN CONTROL.BULLS ARE IN CONTROL.
CRYPTOCAP:BTC Closes the Week above the May high, 50SMA, 50EMA, STH 90EMA and the .382 Fib
IMO THE LOW IS IN.
I still very much expect a large correction around Midterms tho.
Without me even knowing it at the time, my โฟitcoin cycle analysis from ~2.5 years ago points to the actual day of the midterms Nov. 3rd as the low of that correction.
The simulation is predicting Republicans will lose, and markets will puke from fear followed by a sharp rally, similar to how we
Amazon ($AMZN) Daily: Corrective Pullback ApproachesAmazon ( NASDAQ:AMZN ) Daily: Corrective Pullback Approaches Crucial 200-EMA & 226 Support Confluence for Bullish Reversal
### ๐บ๐ธ Amazon.com, Inc. ( NASDAQ:AMZN ) Daily Technical Matrix (Ref: AMZN_2026-09-16_09-30-33.png)
We are issuing an updated Daily (1D) structural study for Amazon.com, Inc. ( NASDAQ:AMZN / NASDAQ). Following a strong rally that reached macro highs near the 286.58 horizontal ceiling, price action has entered a corrective phase. The stock is currently descending toward a hi
BE: Bullish Breakout Above the 50-Day and 200-Day EMAsBloom Energy closed at $275.75 on September 11, 2026, confirming a strong bullish structure on the daily chart.
The stock is trading approximately 18.2% above its 50-day EMA at $233.26 and 39.9% above its 200-day EMA at $197.07. The 50-day EMA remains above the 200-day EMA, while both moving averages support a positive medium-term trend.
BE has also broken above its descending trendline. The latest session ended close to its daily high of $277.28, gaining 6.68% on volume of 13.63 million share
ISRG at a Major Weekly Decision Zone Below the 50 and 200 EMAsISRG is testing a major weekly zone around $355โ$395 after a significant correction from its all-time highs.
The highlighted rectangle marks an important structural area. It acted as resistance in 2021โ2022 before becoming support during the 2024 breakout. The recent rebound shows that buyers are reacting, but a bullish reversal is not confirmed yet.
Price remains below both the blue 50-week EMA and the orange 200-week EMA. The 50-week EMA is declining, while the 200-week EMA is still acting a
S&P 500 ($SPX) 4H: Price Action Retests Crucial 7,576S&P 500 ( SPCFD:SPX ) 4H: Price Action Retests Crucial 7,576 Support Baseline at Make-or-Break Wedge Confluence
### ๐บ๐ธ S&P 500 Index ( SPCFD:SPX / SPCFD) 4-Hour (4H) Technical Matrix (Ref: SPX_2026-09-11_08-41-26.png)
We are issuing an intraday 4-Hour (4H) technical update for the S&P 500 Index ( SPCFD:SPX / SPCFD). Following a corrective move off the recent macro high, price action has pulled back to test a key structural decision node, compressing directly along the lower boundary of its lo
EUR/USD ($EURUSD) Daily: Testing 17-EMA & 200-EMA EUR/USD ( OANDA:EURUSD ) Daily: Testing 17-EMA & 200-EMA Confluences as Price Action Reaches Major Pivot Point
### ๐ถ Euro / U.S. Dollar ( OANDA:EURUSD ) Daily Technical Matrix (Ref: EURUSD_2026-09-08_08-49-57.png)
We are releasing an updated Daily (1D) technical study for EUR/USD ( OANDA:EURUSD / OANDA). Following a recovery leg out of multi-month lows, price action is consolidating near key moving average anchors, establishing a tight decision zone along its ascending trendline guide.
EUR/US
Gold Spot ($XAUUSD) Daily: Testing Key 200-EMA InstitutionalGold Spot ( OANDA:XAUUSD ) Daily: Testing Key 200-EMA Institutional Floor at 4,318 as Price Action Reaches Make-or-Break Confluence
### ๐ช Gold Spot / U.S. Dollar ( OANDA:XAUUSD ) Daily Technical Matrix (Ref: XAUUSD_2026-09-07_08-44-07.png)
We are releasing an updated Daily (1D) technical study for Gold Spot ( OANDA:XAUUSD / OANDA). Following a pull-back off recent local resistance levels, price action has dropped to test a major structural decision node, compressed directly between fast dynami
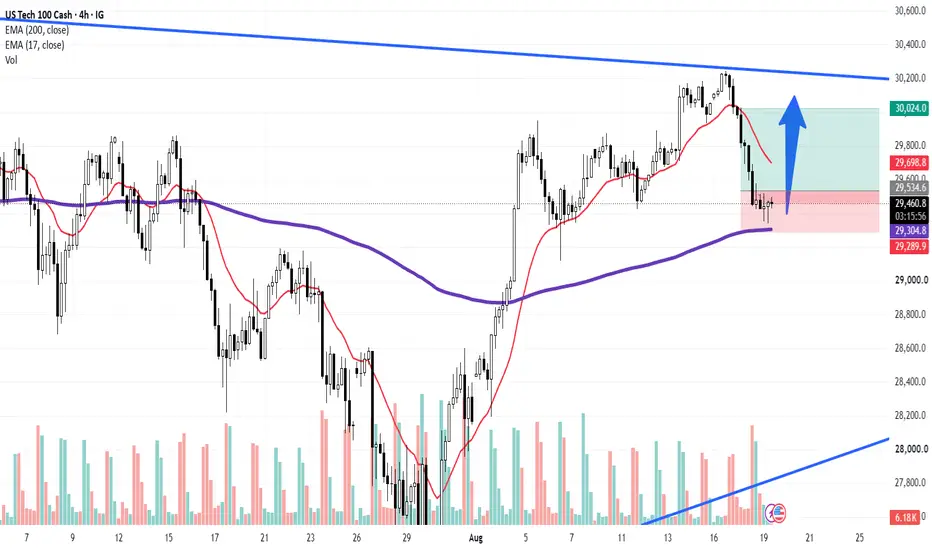
US Tech 100 ($NDX) 4H: 200-EMA Dynamic FloorUS Tech 100 ( NASDAQ:NDX ) 4H: 200-EMA Dynamic Floor Offers 2RR Tactical Rebound Against Daily Corrective Backdrop
### ๐บ๐ธ US Tech 100 Cash ( NASDAQ:NDX / US100) 4H Technical Matrix (Ref: NASDAQ_2026-08-19_08-34-20.png)
We are releasing an updated 4-Hour (4H) intraday execution study on the US Tech 100 Index ( NASDAQ:NDX / US100). Following a sharp sell-off from the upper descending trendline (LTB), price action has reached its primary intraday institutional anchor: the **200-period 4H EMA (pu
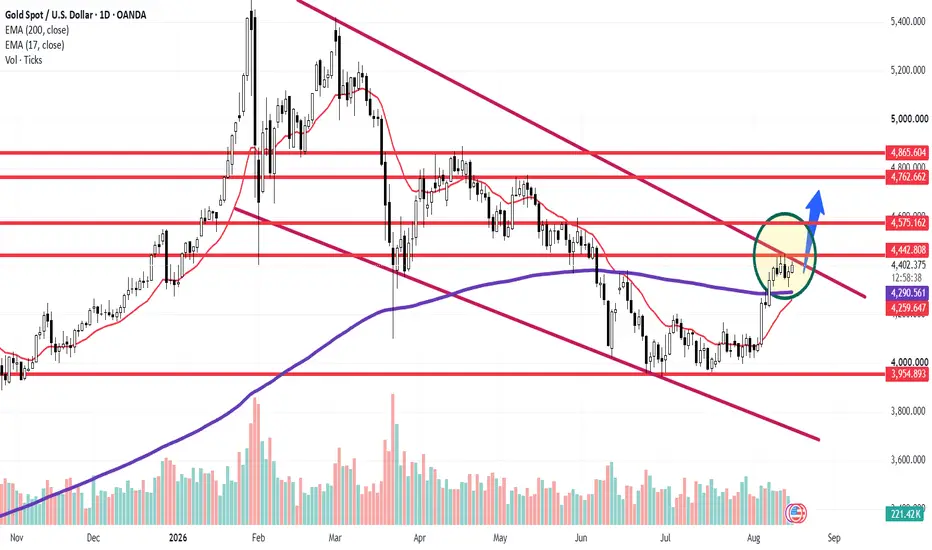
Gold ($XAUUSD) Daily: Dynamic Support Reclaim Sets Up PivotalGold ( OANDA:XAUUSD ) Daily: Dynamic Support Reclaim Sets Up Pivotal Test Against Confluent LTB & 4,442 Resistance Barrier
### ๐จ Gold Spot / U.S. Dollar ( OANDA:XAUUSD ) Daily Technical Matrix (Ref: XAUUSD_2026-08-17_08-58-39.png)
We are releasing an updated Daily (1D) structural study on Gold ( OANDA:XAUUSD ). Following a successful defense and reclaim of its institutional moving average baseline, price action has built a tight accumulation structure (highlighted zone) above dynamic support,
Watani Iron Steel (9513) : Confirmation Before the Next Move !!TADAWUL:9513
๐ Weekly Trendline Retest: Waiting for Confirmation Before the Next Move ๐ธ๐ฆ
The stock has successfully retested its long-term weekly trendline, placing it at a critical technical decision point.
While the setup is becoming increasingly constructive, confirmation is still required before considering a high-conviction entry.
๐ Technical Outlook
The current price action suggests that the market is attempting to convert the previous resistance into support.
However, rather than
The 9-21-41 EMA Strategy I Recommend Every Beginner Should LearnMost traders don't lose money because their entries are bad.
They lose money because they enter too early...
Exit too early...
Or trade against the trend.
A simple trading strategy should answer only three questions.
When should I enter?
Where should I place my stop loss?
When should I exit?
This strategy is designed to answer all three.
โโโโโโโโโโโโโโโโโโโโโโโโโโโโโโโโโโ
The Logic Behind This Strategy
Every moving average has a different purpose.
9 EMA
Represents short-term momen
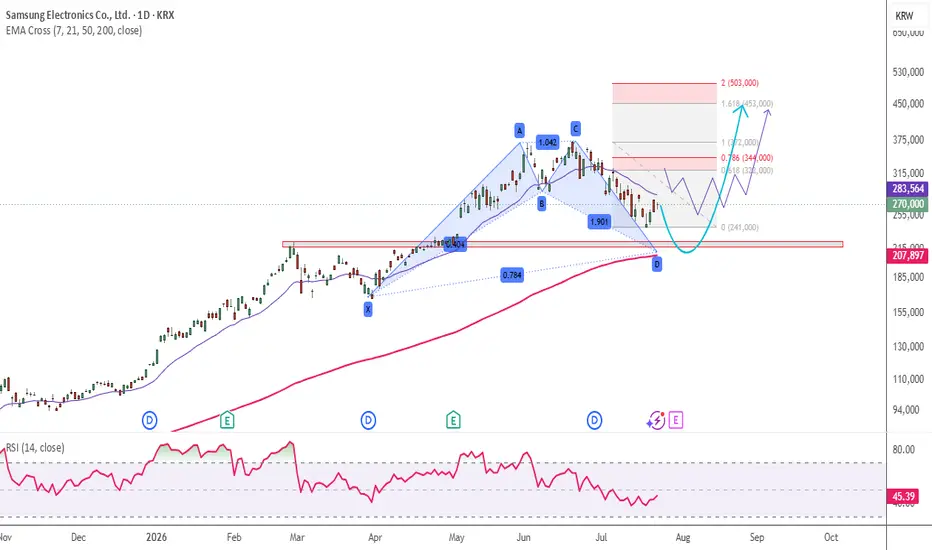
Samsung Electronics : Pullback Before the Next Rally ?KRX:005930 Daily Chart
๐ Key Decision Zone Ahead: Pullback Before the Next Rally? ๐
The stock has staged an impressive recovery after rebounding from the 0.55 Fibonacci retracement zone, confirming strong buying interest from a major technical support area.
However, the next challenge has arrived.
๐ Technical Outlook
Price is now testing the Daily 20 EMA, which is acting as an immediate resistance level.
A decisive breakout above this dynamic resistance would strengthen the short-term bul
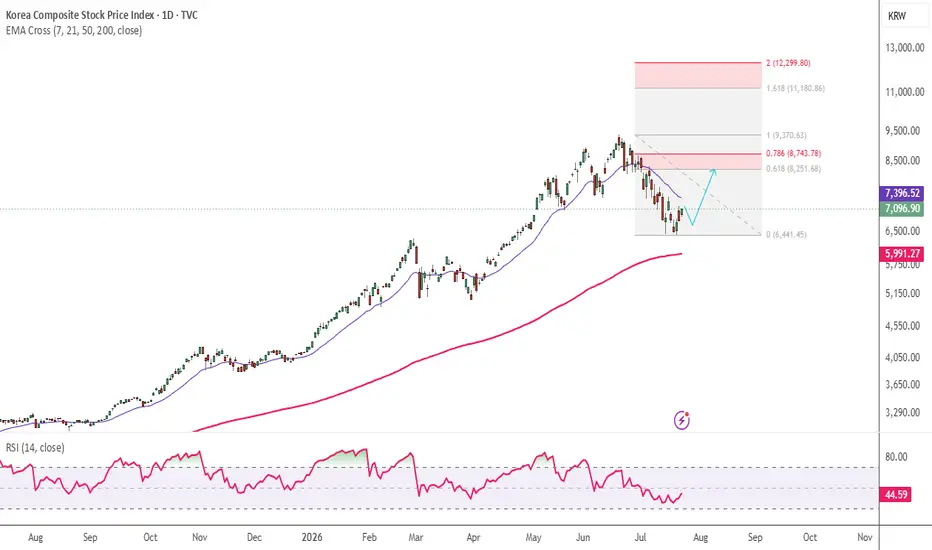
KOSPI : Bull Trap or Continuation Rally ?TVC:KOSPI
๐ Korea's "Talk of the Town" Index at a Critical Inflection Point โ Breakout or Bull Trap? ๐ฐ๐ท
After forming a convincing double bottom near the 6,440 zone, the index has staged a healthy rebound and is now approaching the 20-day EMA, a key dynamic resistance level that could determine the next major trend.
The coming weeks may define whether this recovery evolves into a sustained uptrendโor proves to be another relief rally.
๐ Technical Outlook
The recent double-bottom formation
National Medical Care : Is the Long-Term Trend Still at Risk?TADAWUL:4005
๐ Distribution Above 150โ220: Is the Long-Term Trend Still at Risk? โ ๏ธ
Price spent a considerable period in a distribution range between 150 and 220, suggesting significant supply was being absorbed by the market.
The 200 EMA remained in a strong uptrend until October 2024. However, the subsequent breakdown below this key long-term moving average marked a significant shift in market structure.
The brief recovery above the 200 EMA may have acted as a bull trap, attracting long-
Bullish EMA Cross Trapped Under the 200: Fading the Bear RallyBINANCE:ETHUSDT
The 20 EMA just crossed above the 50 EMA on the daily โ normally a bullish signal. But context kills it. Price is printing this crossover ~17% below the 200 EMA ($2,200), deep inside a macro downtrend that's been in control since late April.
This is a bear rally, not a trend reversal.
๐ Setup:
After dropping from $2,700 to $1,500 in MayโJune, ETH bounced sharply. The 20/50 crossover confirms short-term momentum โ but it's happening under heavy overhead resistance with the 20