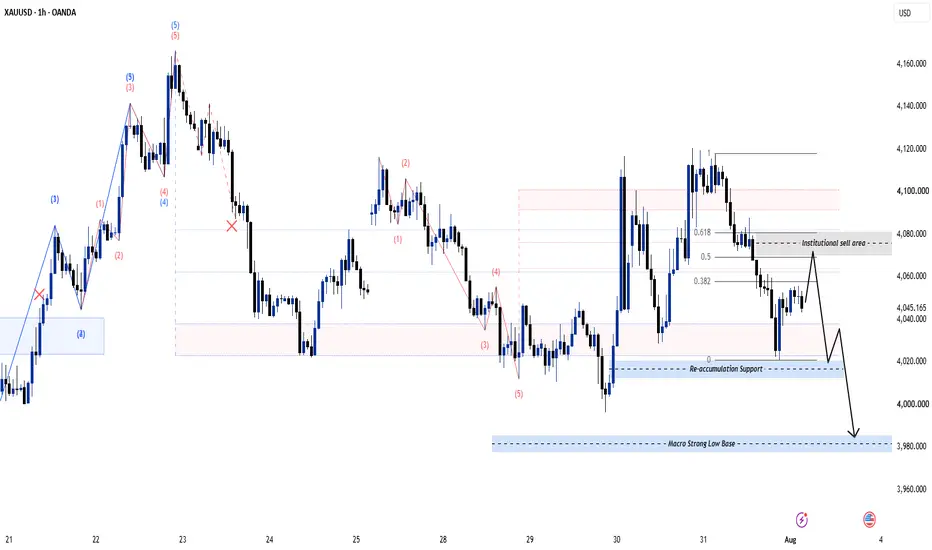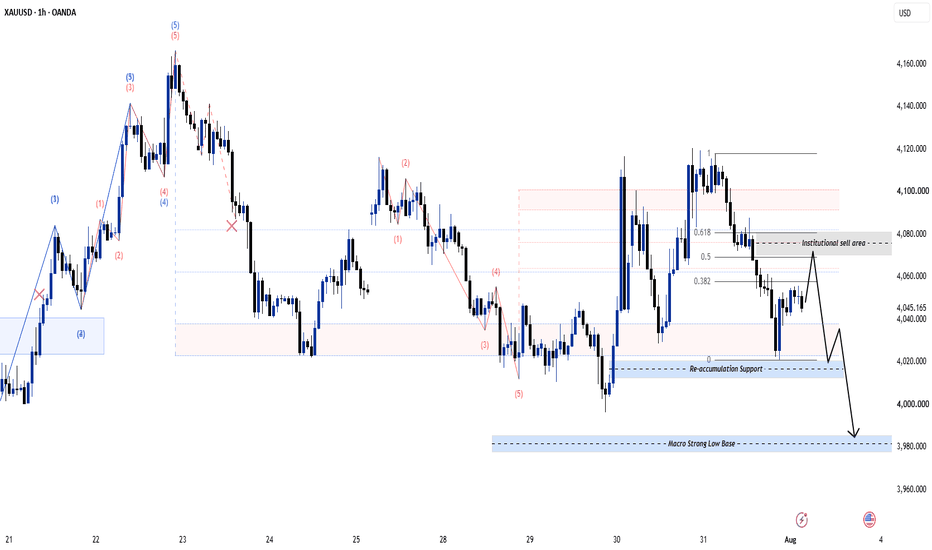
Gold H1: 4,020 Sweep Before Another Selloff?
📊 H1 Market Structure
After printing a strong impulsive rally, price has entered a corrective sequence.
The latest decline rejected the premium dealing range while respecting the 50%-61.8% retracement, suggesting institutions are distributing inventory rather than initiating fresh buying.
Current structure:
• Lower High developing beneath 4,110
• Bearish market structure remains intact
• Retracement into premium completed
• Discount liquidity remains untouched
As long as price trades be
Fibonacci Retracement
Fibonacci Retracement: Only Works Where the Chart Has StructureA Fibonacci retracement can be drawn between almost any two points on a chart, and it always produces the same tidy grid. That is the problem. The tool looks objective while the only objective input is where you decided to click. A Fibonacci level is not a forecast. It is a place where a lot of traders happen to be looking at once, and it becomes tradeable only when it lands on structure the chart already had.
The evidence supports that skepticism. Roy Batchelor and Richard Ramyar tested whethe
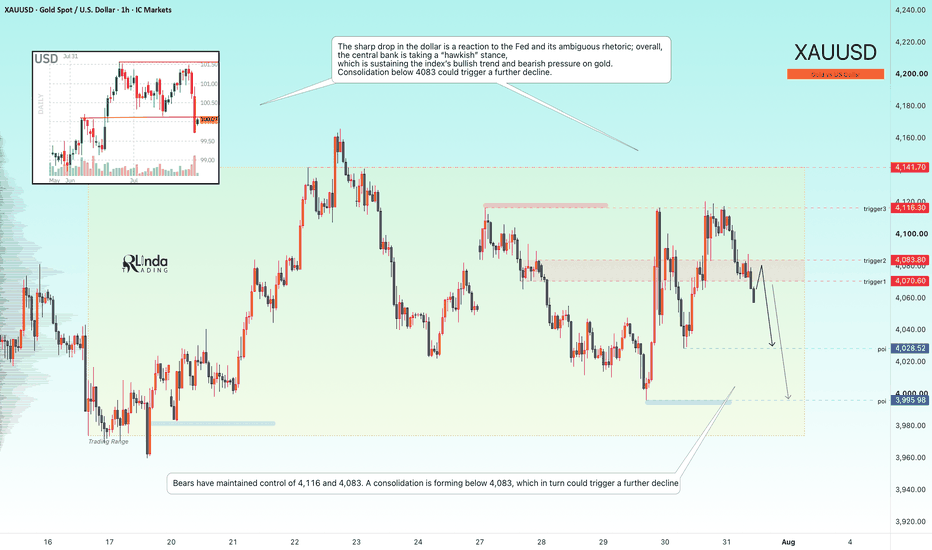
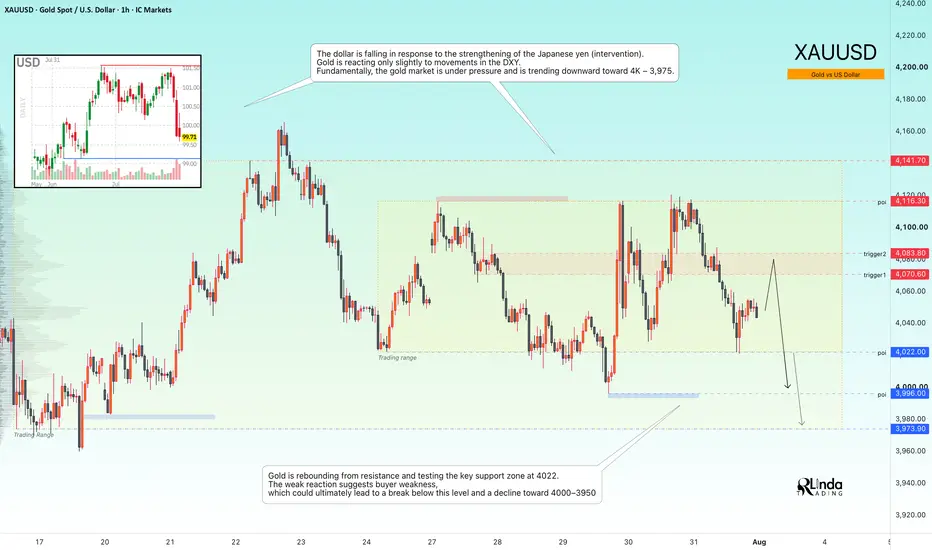
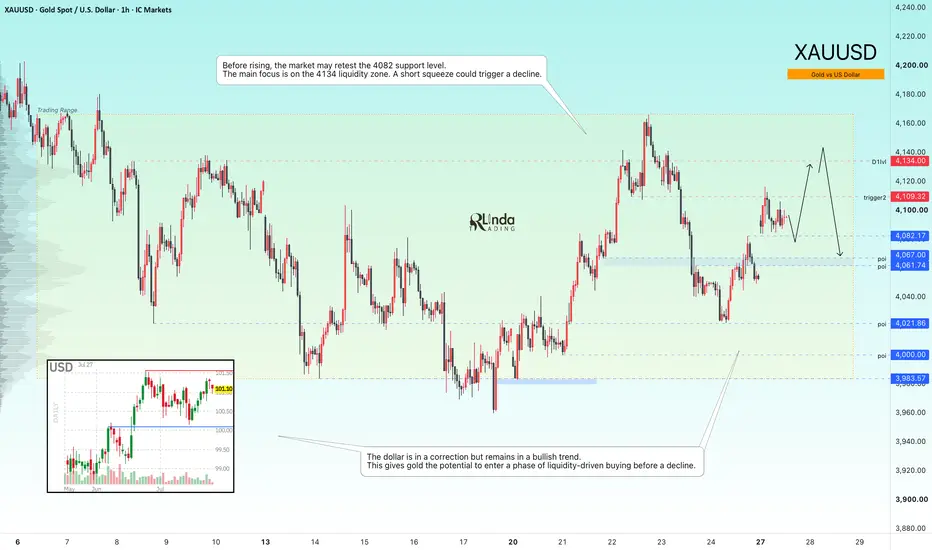
GOLD - Consolidation Amid a Bearish Trend ICMARKETS:XAUUSD remains trapped within the 4022–4116 trading range as markets await the next major economic catalysts. From a technical perspective, however, the broader bearish trend continues to dominate
The U.S. dollar has weakened following renewed strength in the Japanese yen, driven by intervention efforts. Despite this, gold has shown only a muted response to the decline in the DXY. Fundamentally, the metal remains under pressure, with the market still favoring a move toward the 40
Gold H1: Is $4,030 the Next Liquidity Sweep?Gold is trading around $4,074 after rejecting the $4,110–$4,120 supply zone. The H1 chart now shows a corrective pullback toward rising trendline support and the $4,060–$4,065 demand area.
Macro remains highly event-driven. The Fed held rates at 3.50%–3.75%, while June PCE showed inflation cooling but still elevated. That keeps USD/yields as key drivers for Gold volatility.
📊 H1 SMC Structure
BSL / Supply: $4,110–$4,120
Immediate POI: $4,060–$4,065
Primary Demand: $4,030–$4,035
Major Discount:
GOLD - The bearish trend continuesICMARKETS:XAUUSD remains in a medium-term bearish trend. The recent attempt to break above 4116 failed, and the market has once again transitioned into a selling phase
Gold is currently caught between geopolitical tensions, which tend to strengthen the U.S. dollar, and expectations surrounding upcoming central bank decisions. The next directional move will largely depend on developments in the Middle East and signals from the Bank of Japan. A continued hawkish stance from the Federal Reserve
Watani Iron Steel (9513) : Confirmation Before the Next Move !!TADAWUL:9513
📈 Weekly Trendline Retest: Waiting for Confirmation Before the Next Move 🇸🇦
The stock has successfully retested its long-term weekly trendline, placing it at a critical technical decision point.
While the setup is becoming increasingly constructive, confirmation is still required before considering a high-conviction entry.
🔍 Technical Outlook
The current price action suggests that the market is attempting to convert the previous resistance into support.
However, rather than
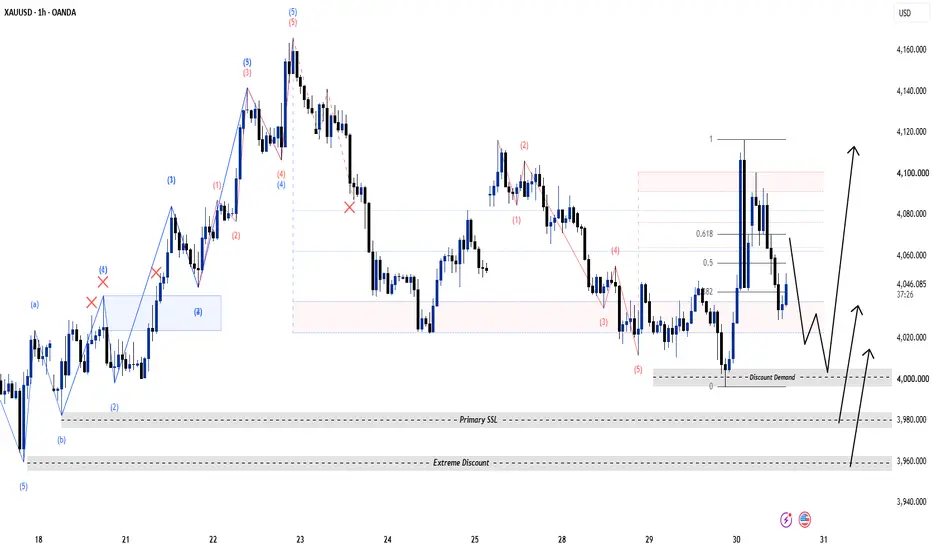
Gold H1: Is $4,000 the Next Liquidity Sweep?Gold is trading around $4,047, after the FOMC kept rates unchanged. The market is now shifting attention toward US Q2 GDP and June PCE, keeping volatility elevated. Gold initially reacted positively to the Fed decision, while the dollar eased, but the inflation data could still reshape rate expectations.
H1 Structure
The chart shows a clear bullish recovery from the $3,960–$3,980 discount area.
H1 impulsive leg remains constructive.
Price is currently retracing from the $4,100–$4,115 premium
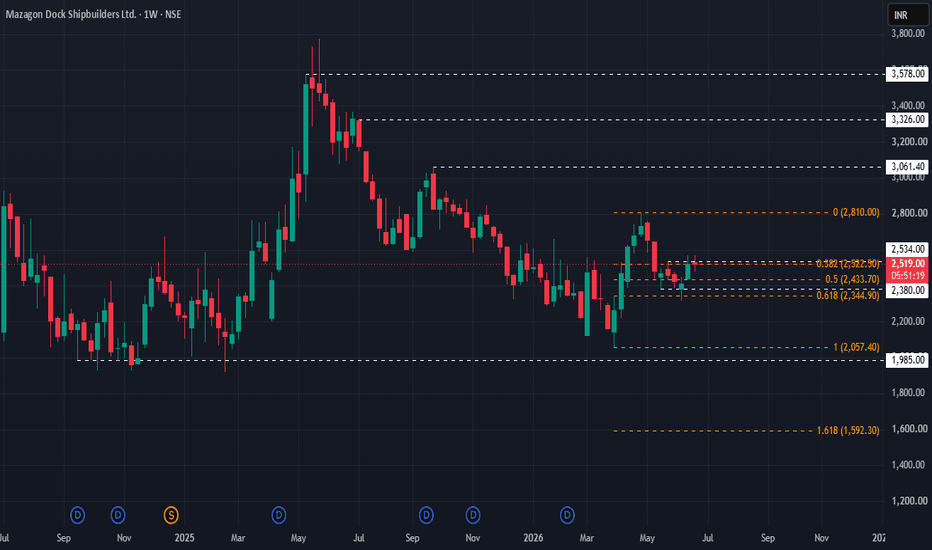
Mazagon Dock: Potential Reversal Candidate with Multi-Timeframe Mazagon Dock: Potential Reversal Candidate with Multi-Timeframe Bullish Setup
Mazagon Dock Shipbuilders Ltd. – Technical View
CMP: ₹2,523
Stop Loss: ₹2,310
Targets: ₹2,810 | ₹3,061 | 3326
Mazagon Dock is emerging as a potential reversal candidate, supported by bullish formations across multiple timeframes.
On the daily chart, the stock is forming a Flag & Pole continuation pattern. A decisive breakout above ₹2,569 could confirm the pattern and trigger fresh upside momentum.
On the weekly c
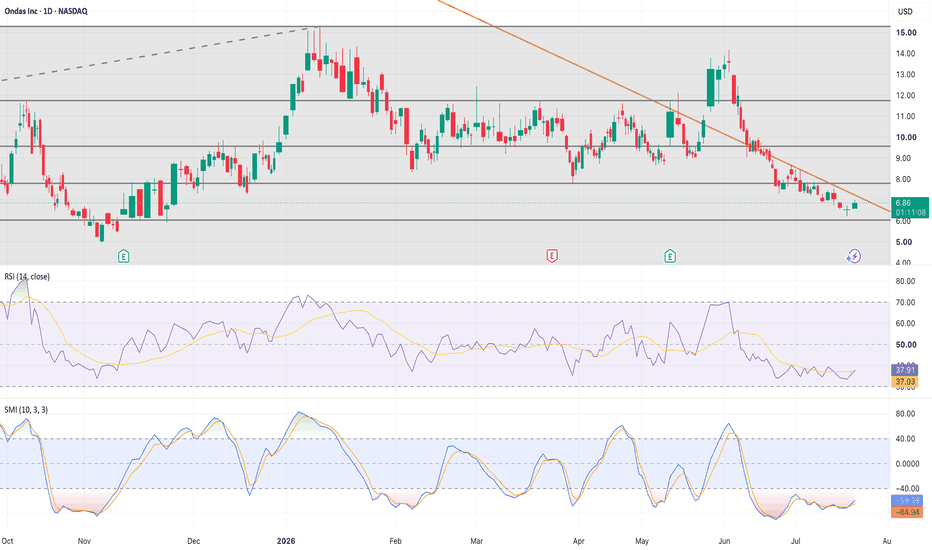
ONDS is ready to popONDS has been heavily shorted, but the long-term story is only improving. In various interviews, I've watched the CEO deliver a compelling story for the future and it seemed ONDS has a chance to become a drone empire. I was so convinced that I decided to invest my 401K and ROTH accounts in ONDS.
On the technical front, I see we may be ready to start a bull run.
- 61.80% retracement from all time lows to recent highs
- RSI is oversold
- SMI is ready to move up after a failed attempt in early Ju
EURUSD | Buy-Side Liquidity Sweep Signals Bearish ContinuationEURUSD continues to present a bearish technical outlook following a buy-side liquidity sweep above the 1.14750 resistance level and the 2 July high, where price failed to sustain bullish momentum before rejecting lower. This liquidity grab suggests that buying pressure may have been exhausted, shifting the focus towards a potential continuation of the prevailing bearish structure. I will be monitoring a retracement into the highlighted retest zone, where multiple technical factors converge, incl
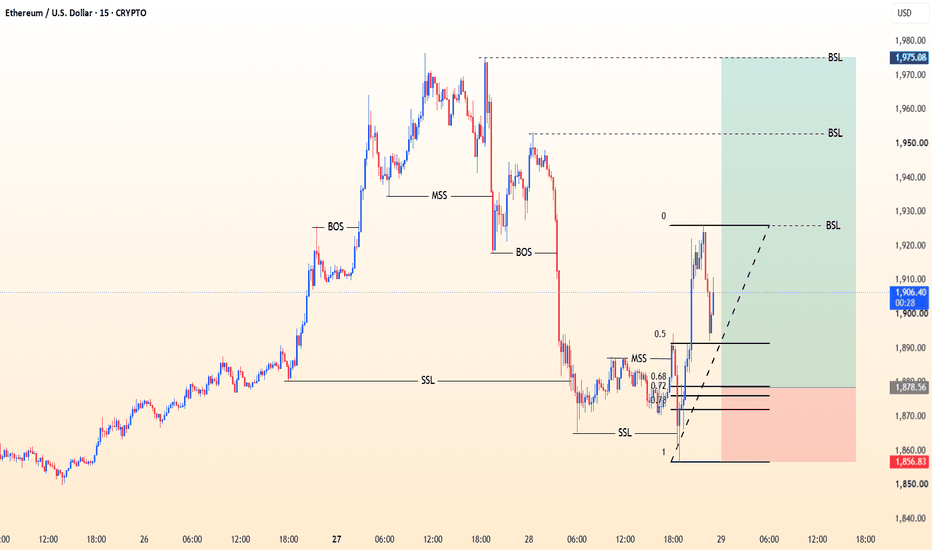
ETHUSD: Golden OTE Zone (0.72–0.78) + MSS | Long to 1975 BSLExecutive Summary & Signal Overview
📍 Asset: ETH/USD (Ethereum / US Dollar)
🐂 Position Type: Limit Buy / Long Entry
🏁 Buy Zone: 1,875.00 – 1,880.00
🛡️ Stop Loss (SL): 1,856.83 (Below Fibonacci Level 1 / Swing Low)
🎯 Target 1 (BSL 1): 1,925.00 (Fib Anchor Peak)
🎯 Target 2 (BSL 2): 1,952.00 (Intermediate High)
🎯 Target 3 (BSL 3): 1,975.00 (Major Range High)
⚖️ Risk-to-Reward (R:R): 1 : 4.4+
🔍 2. Technical & Confluence Brea
Filing & Packing Material (2180) : Bull Run or Cool Off for now?TADAWUL:2180
📈 Weekly Trend Reversal Confirmed — Is This the Beginning of a Bigger Bull Run? 🇸🇦
After an extended period of consolidation, the weekly chart has officially shifted into a bullish market structure, with price now printing a series of Higher Highs (HHs) and Higher Lows (HLs)—one of the strongest technical signals that a trend reversal may already be underway.
The focus now shifts from identifying the bottom to managing the next phase of the uptrend.
🔍 Technical Outlook
The re
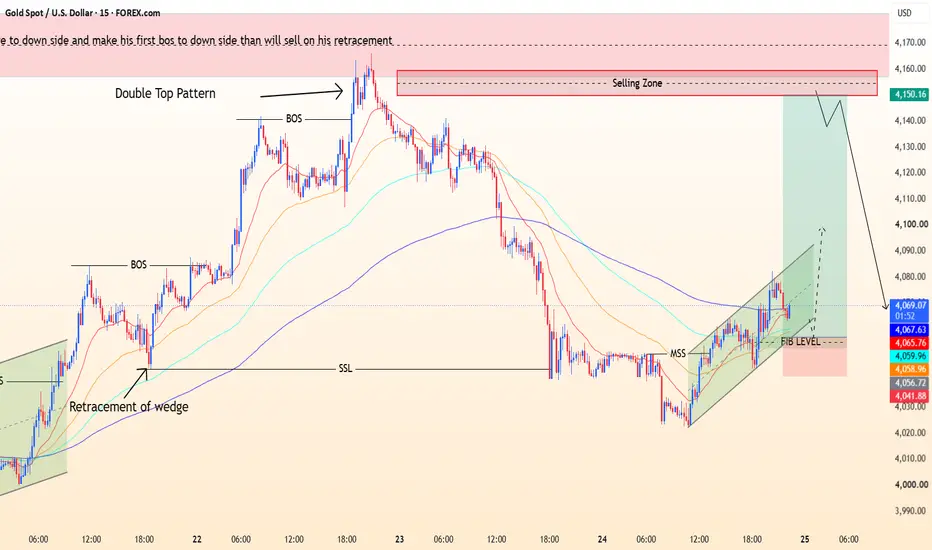
INSTITUTIONAL ORDER FLOW: XAU/USD (SHORT)Asset: Gold Spot / U.S. Dollar (XAU/USD)
Timeframe: 15-Minute (M15)
Order Type: Limit / Market Execution
🎯 Key Trade Parameters
Execution Zone: 4,075.50 – 4,070.00 (FVG Rebalance / OTE Refinement)
Invalidation (SL): 4,096.15 (Above Liquidity Sweep High)
Take Profit 1 (TP1): 4,030.00 (Internal SSL / Liquidity Target)
Take Profit 2 (TP2): 3,996.40 (Major Draw on Liquidity / SSL)
📊 Technical Confluences
Liquidity Purge: Clean sweep of Buy-Side Liquidity (BSL) preceding the move, absorbing li
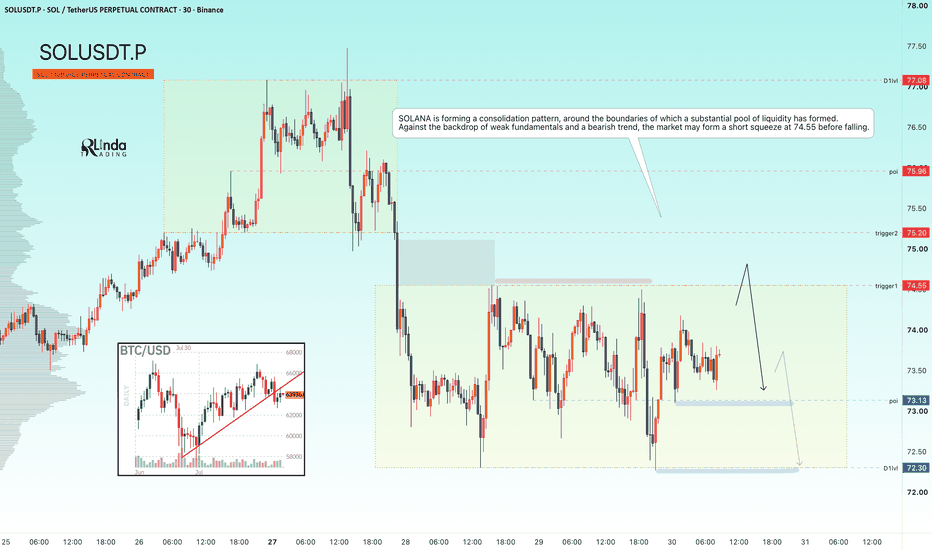
SOLUSDT - Manipulation by MM could trigger a drop BINANCE:SOLUSDT remains in a broader bearish trend, with price developing a local downtrend inside the 74.55–72.30 trading range. Within this structure, I expect a potential market maker manipulation phase
The fundamental backdrop for the cryptocurrency market remains weak. Bitcoin has already broken its local bullish structure and is building bearish momentum ahead of a possible continuation lower. Further weakness in the market leader could weigh on the rest of the crypto market
Against
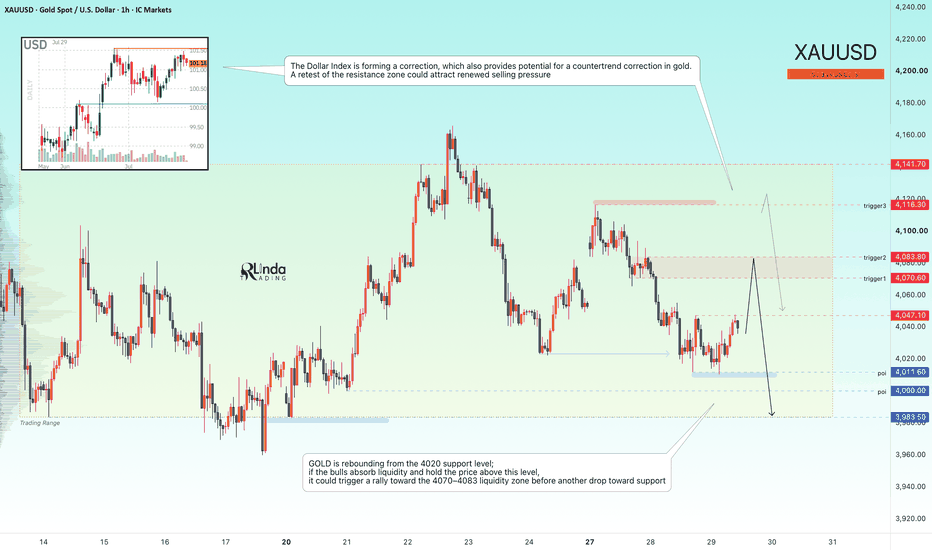
GOLD - Ahead of the Fed meeting. Bearish trendICMARKETS:XAUUSD is rebounding from the 4000 level but remains trapped within the 4010–4050 trading range. At the same time, the U.S. Dollar Index has entered a consolidation phase as markets await the upcoming Federal Reserve meeting
Gold is trading cautiously ahead of the Fed decision amid renewed geopolitical tensions. The key catalyst will be the Fed's guidance on the future path of interest rates. Any hint of a dovish shift could fuel a rally in gold, while a hawkish message would lik
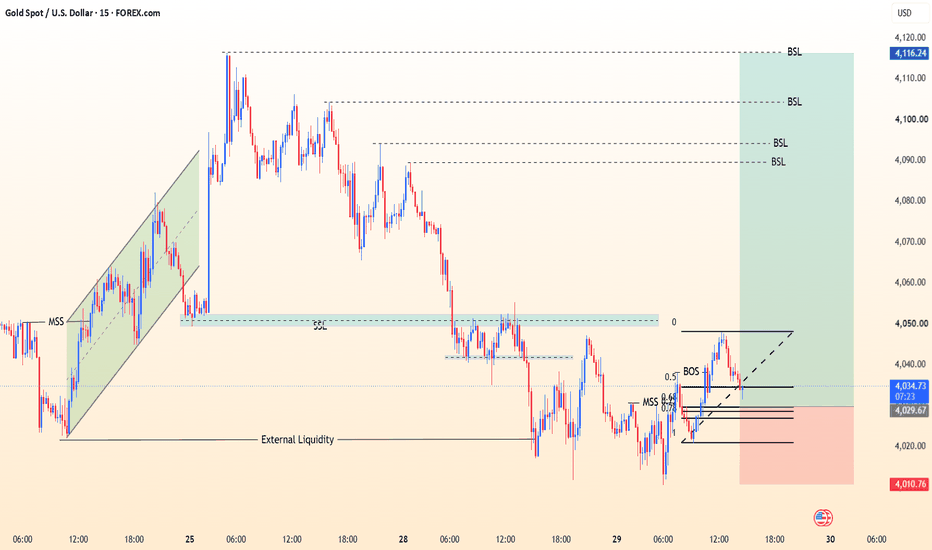
XAU/USD FOMC Trade Plan: Fibonacci Discount Buy Zone AnalysisTrade Plan: XAU/USD Buy Setup
Bias: Bullish (Smart Money Concepts / ICT)Entry Zone: 4,025.00 – 4,030.00 (0.618–0.786 Fibonacci OTE Discount)
Stop Loss: 4,010.76 (Below recent structural swing low)
Take Profit Targets: TP 1: 4,090.00 (Internal BSL)
TP 2: 4,100.00 (Psychological level / BSL)
TP 3: 4,116.24 (Main BSL target)
⚡ Technical Logic Liquidity Sweep: Price took out external liquidity around 4,020.00.Structure: Market Structure Shift (MSS) followed by a Break of Structure (BOS) confirms sh
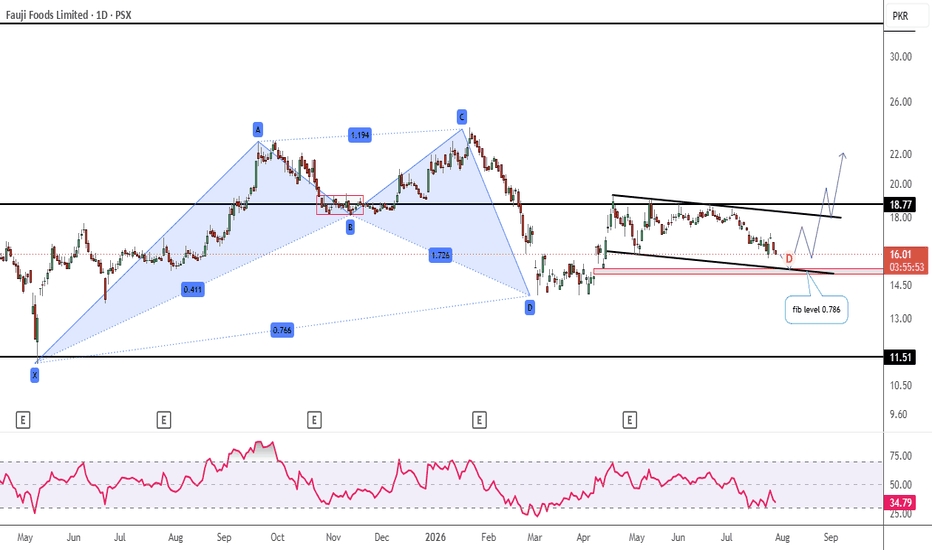
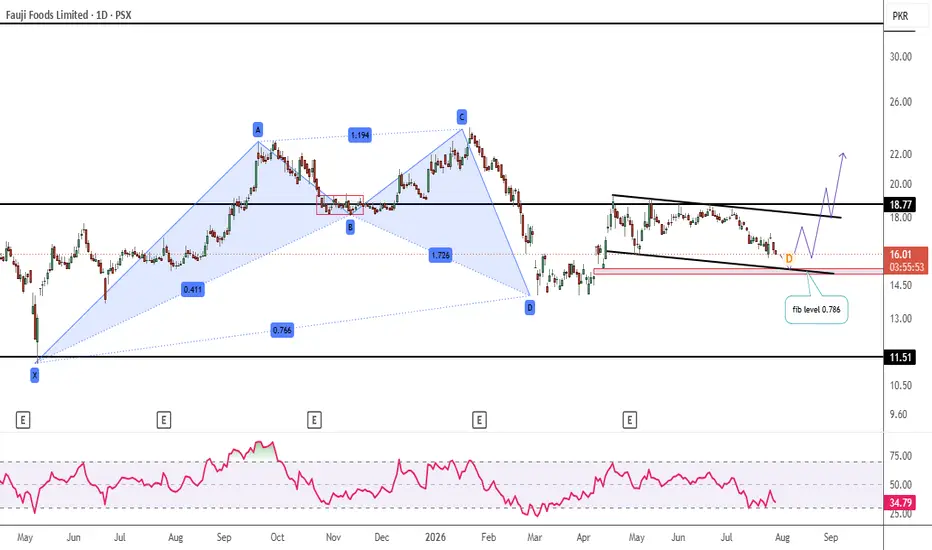
FFL 🇵🇰: High-Probability Reversal Setup ?PSX:FFL
📉 Discount Zone Approaching: Is This the Next High-Probability Reversal Setup? 🇵🇰📈
The stock is gradually moving toward the 0.786 Fibonacci retracement level—a zone that has historically acted as a high-conviction demand area.
From a price action perspective, this is a level worth watching closely rather than chasing the current move.
🔍 Why the 0.786 Fibonacci Level Matters
Looking at the stock's previous major correction, price respected the 0.786 Fibonacci retracement almost per
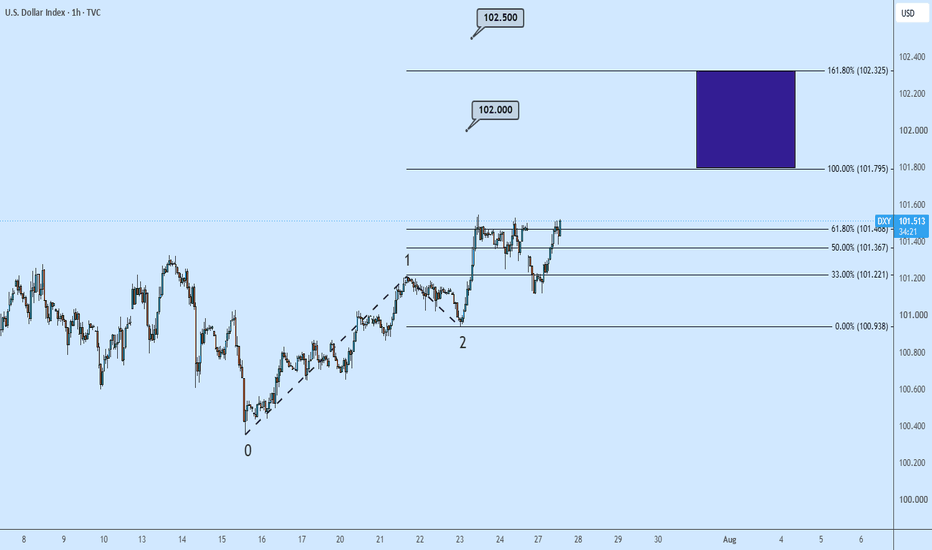
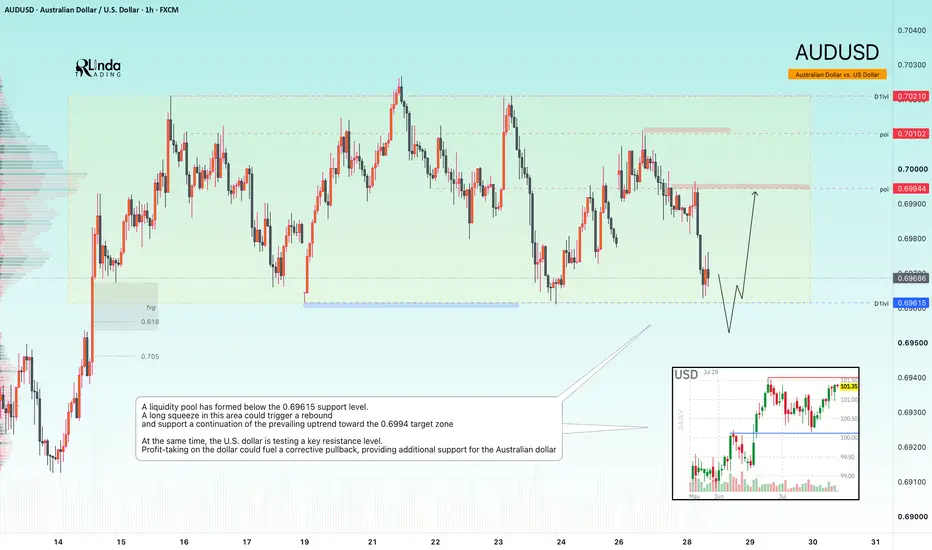
AUDUSD - A long squeeze could trigger a rally FX:AUDUSD is testing a key support zone, with a significant liquidity pool positioned just below it. The broader daily trend remains bullish, giving buyers an opportunity to regain control
At the same time, the U.S. Dollar Index is testing resistance. Profit-taking near the 101.5 area could trigger a pullback in the dollar, providing additional support for the Australian dollar.
From a technical perspective, a substantial liquidity pool has formed below 0.69615. A long squeeze in this area
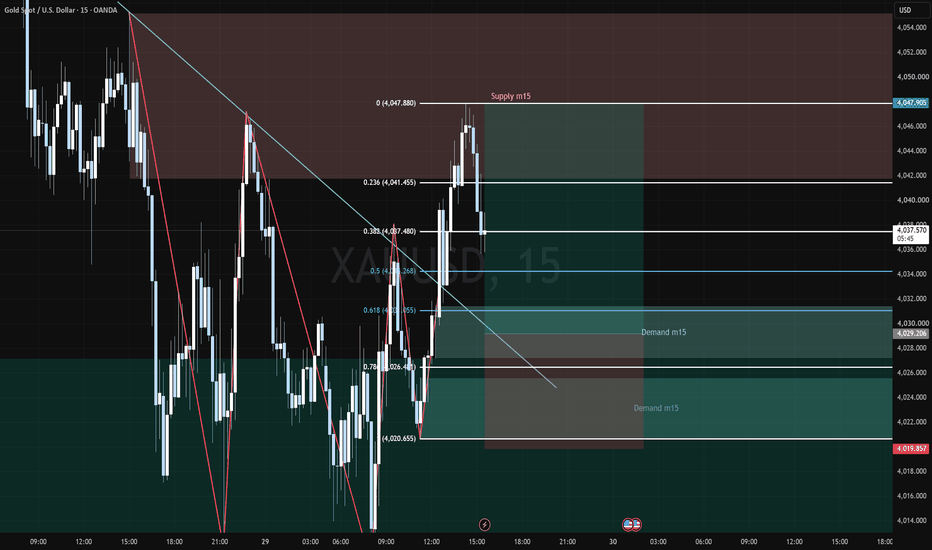
XAU/USD Bullish Trade Setup Demand & Fib Confluence🔍 Technical Confluence Breakdown
⚡ Market Structure Shift (MSS): Price swept sell-side liquidity (SSL) around ~4,020 and broke structure to the upside, flipping short-term 15-minute momentum from bearish to bullish.
🎯 Premium Demand & Fib Zone (4,050 – 4,056): Retracements into the 0.72 – 0.78 Fibonacci levels align directly with lower channel support and fresh demand, offering a high-probability Optimal Trade Entry (OTE).
🏁 Profit Target & Major Resistance: Upside target points toward the 4,1
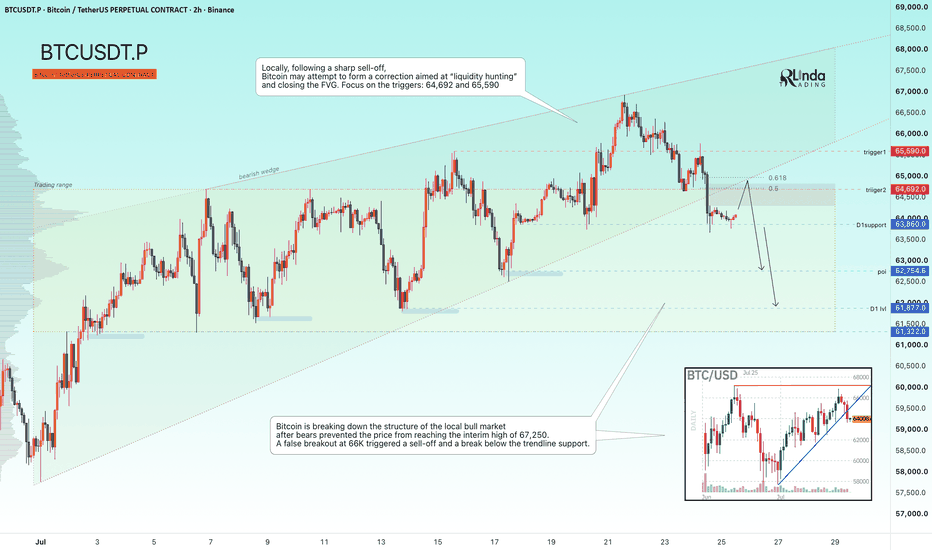
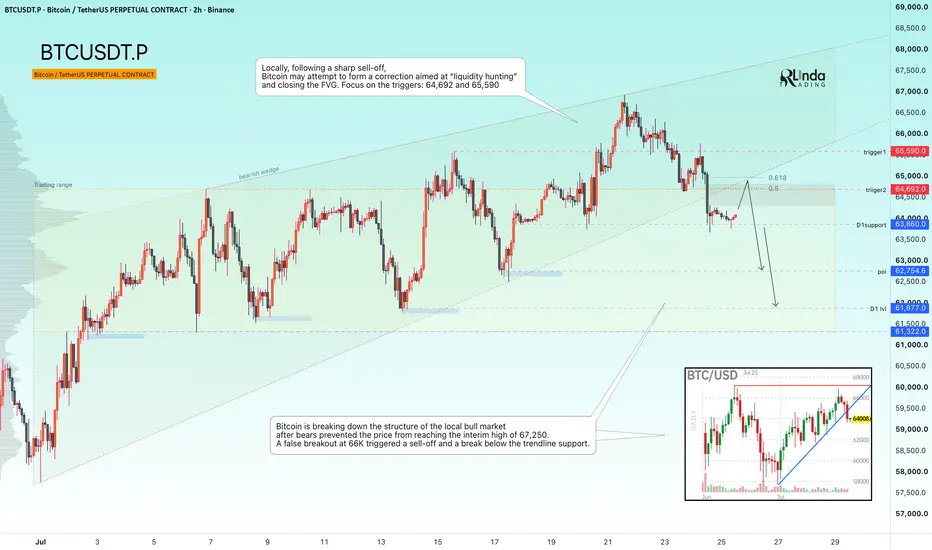
BITCOIN - A countertrend correction before a decline BINANCE:BTCUSDT.P is breaking the local bullish market structure within a broader bearish distribution phase while also forming a false breakdown below the 63,680 support area. The market continues to reinforce the dominance of the higher-timeframe bearish trend, although a corrective rebound remains possible before the next leg lower
Higher timeframe: The broader bearish trend remains intact. Sellers prevented price from reaching the key technical retracement level at 67,250, while a weak
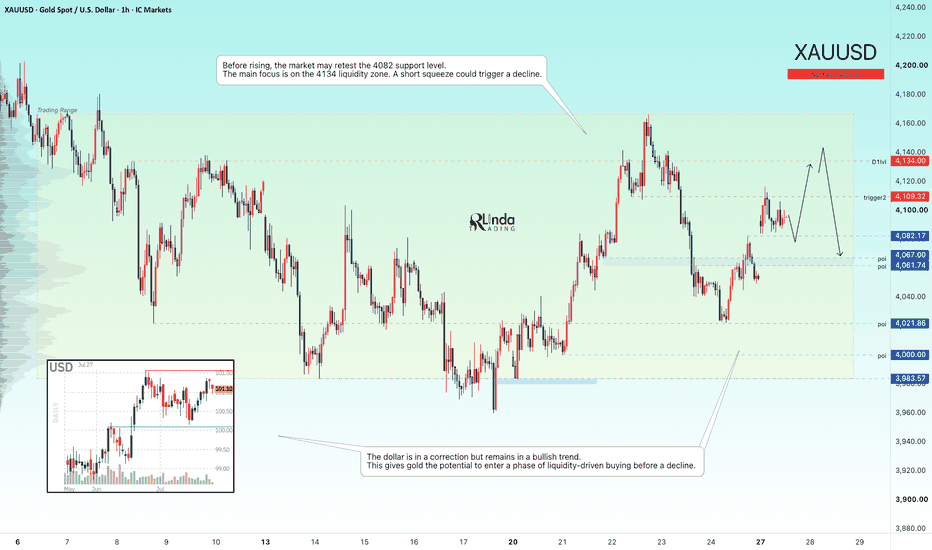
GOLD - Correction Before a Decline ICMARKETS:XAUUSD remains under pressure from the broader bearish trend. However, within this primary direction, the market is developing a sideways range and a countertrend correction. A stronger U.S. dollar could once again weigh on the metal
Gold has received temporary support from the recent geopolitical pause and a softer U.S. dollar. However, the sustainability of the recovery remains uncertain as markets await the upcoming Federal Reserve decision and further developments in the Midd
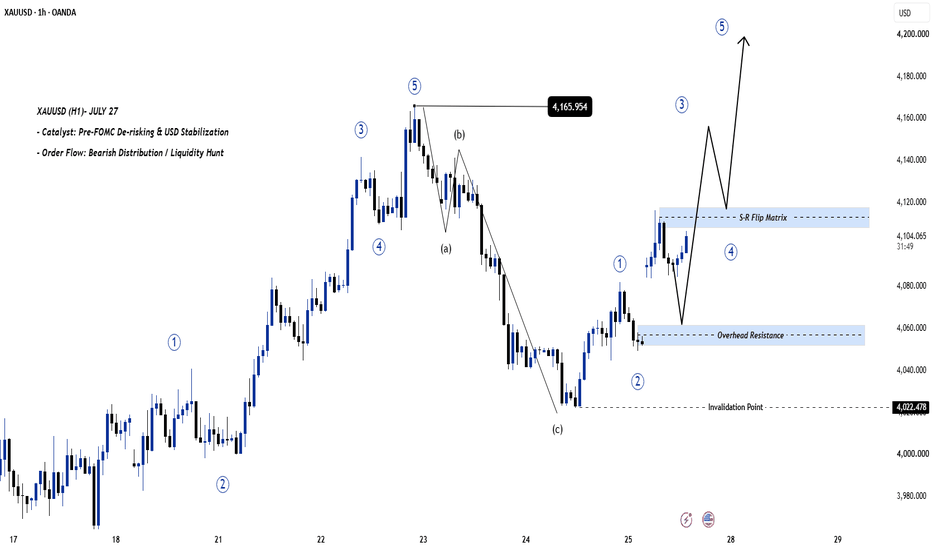
XAUUSD (H1) | Elliott Wave 3 Launchpad?
Key Support Zone At 4,055 - 4,060 Holds The Line
Gold (XAUUSD) continues to display exceptional structural strength on the H1 timeframe. Following the completion of a textbook (a)-(b)-(c) corrective cycle down to the structural floor, buyers have stepped in aggressively to defend key higher-lows.
With Pre-FOMC market dynamics causing selective positioning across major dollar pairs, Gold's order flow reveals a clear Bullish Accumulation / Re-accumulation pattern. As long as the market respects