Long
Long
COIN: THE BLUE-CHIP THAT TRADES LIKE A S COINDuring this Nasdaq meltup, investors are hunting for growth anywhere they can find.
Tech firms with expanding margins (like Nvidia or Microsoft).
Small cap drone manufacturers that are in the right sector, anything AI related, Power.
Give people a story and they will bid it up.
As a Bitcoin proxy, it plays second fiddle to MSTR.
If they are using NASDAQ:COIN for exchange fees... then fees are larger when there is industry FOMO.
There is none currently.
Liquidity-Driven Fractals: If you strip the ticker labels off the chart, a speculative memecoin and supposed institutionally owned "proxy-equity" like NASDAQ:COIN , they look nearly identical.
High-Slope Rallies: Powered by FOMO, not earnings reports.
Volatile Reversals: Characterised by "liquidation events" rather than fundamental re-ratings.
The "Exit Liquidity" Problem: Just like a shitcoin, NASDAQ:COIN is dependent on the "onboarding of new participants" (the retail FOMO crowd) to sustain its price level.
When the retail liquidity dries up, the "altcoin chart" behaviour dictates that the stock will see a sharper, more violent drawdown than a traditional "blue-chip" tech stock.
Structural Fragility: Traditional Nasdaq stocks (like the Mag 7) have massive institutional "floors"—dividend payouts, stock buybacks, and deep cash reserves.
NASDAQ:COIN , like a classic shitcoin, lacks these fundamental stabilisers, leaving it exposed to the whims of the speculative cycle.  Short
Short
 Long
Long
Long 
 Long
Long
AVGO: Speculative Topping Scenario — Tracking The Chip Trade📉 🖥️ 🇨🇳 📊 🚀
1. The Fundamental Shift: Broadcom’s Cautious Guidance Shock
While the retail crowd continues to buy every single technology dip under the assumption that AI infrastructure spending is an infinite money printing press, the smart capital is watching corporate guidance closely.
The semiconductor sector suffered a massive, historic shock when Broadcom reported its fiscal Q2 earnings. While the headline numbers beat consensus, management's Q3 AI chip sales guidance of $16 billion fell short of Wall Street's $17.2 billion estimate, and Hock Tan pointedly refused to raise the company's full-year 2026 AI semiconductor forecast.
This single cautious note triggered a brutal, historic two-day correction across June 4–5 that abruptly erased $1.3 trillion in tech valuations, sending the Philadelphia Semiconductor Index (SOX) down over 10%.
Furthermore, underlying changes in major contracts—like Anthropic restructuring its $10 billion TPU order to strip out high-margin rack-level revenue and limit Broadcom strictly to lower-margin chips—suggest that hyperscalers are aggressively tuning their spending structures to control costs.
2. Confirming the On-Chain Reality: The Chinese Token Boom
According to aggregate platform analytics from OpenRouter and data compiled by the Financial Times, Chinese AI models have completely overtaken US models in global token consumption.
The Volume Split: Models like DeepSeek V4 Flash (4.63 trillion tokens) and MiniMax M3 (4.13 trillion tokens) are completely dominating global top 5 usage rankings.
Where is the US?
Anthropic's Claude is the only US model clinging to the top 5, while Google's Gemini and OpenAI's GPT flagships have drifted down to 12th and 13th in global token volume rankings.
Why this matters for Western Silicon: Chinese labs can charge a fraction of US prices due to massive local algorithmic efficiency and drastically lower energy overhead.
Because US enterprise AI deployment costs have begun testing corporate budgets, giants like Amazon, Walmart, Uber, and Meta have begun implementing strict token usage caps or forcing employees onto cheaper, open-source models.
If the enterprise market shifts to lower-cost, highly optimised models, the parabolic demand curve for ultra-premium US hardware could experience a sharp structural deceleration.
3. The Execution Parameters (IF Activated)
Looking at the daily chart of #AVGO the price is currently idling around 411.35, well below the macro high of 495.00.
A Waiting Game & Taking Bi directional bets.
The Activation Line: A breakdown in a potential bear flag could see prices in the low 300's before many market players start to really take notice.
At which point a counter rally to form the right shoulder will begin.
local support blocks exposes the crucial horizontal neckline at 289.87.
The Downside Vacuum Target: If the macro funnel breaks down entirely as projected, the outside extension line points to a massive long-term downside target at 170.19.
That is the Log target.
We will draw out a linear target if and when the head and shoulders forms and triggers.
We are keeping our feet firmly on the ground while the market decides its direction.
If the structural top locks in, the downside asymmetry will be spectacular.
#AVGO #Semiconductors #AILandscape #TokenUsage #Broadcom #PriceAction #ShortScenario #TradingView #TechnicalAnalysis  Long
Long
 Long
Long
Flag Formation - INTC IntelIn my view, the flag pattern is clean. The flagpole runs from the gap breakout on April 21 (~$66) to the all-time high of $132.75 on May 11—a gain of around 100% in three weeks. The subsequent consolidation ($99.17 → $132; ~25% retracement, 5 weeks, declining volume) is a textbook flag, not some weak wedge. The breakout occurred on June 18: daily high of $135.48, close at $133.99, with volume of 234M against a 20-day average of 131M—roughly 1.78x the average. That is exactly the kind of breakout volume you want to see. The stack looks good, too: price > SMA50 ($101) > SMA200 ($56)—cleanly tiered.
Classic flag target = add the flagpole length to the breakout point: $132.75 + ~$66.75 = ~$199. This aligns with the target on your chart.
Probability assessment (with caveats):
— Pros: High-quality setup (volume, stack, pattern geometry); the move is fundamentally supported by the foundry narrative and demand for AI PCs/server CPUs; the rare-earth/supply argument is relevant in the medium term.
— Cons: A 100% gain (from the gap) or ~500% from the September low is already priced in—we aren't buying a bargain, we're buying strength. A pullback or retest of the $132 zone would be normal. Earnings on July 23 are a risk event within the trade range—carrying gap risk in either direction. AMD and NVDA remain tough competitors in the AI segment, though they were back in April, too!
— Invalidation: A daily close below $111 kills the flag pattern (swing low on June 11 was $110.51). Our position: Long 12 shares @ $134.80 (stop-buy triggered June 18), SL $111.37, TP1 $178.57 — R:R 2.11:1 to TP1, ~2.85:1 if it runs to $199. Set deliberately below the pure flag target due to intervening earnings.
This does not constitute investment advice; use at your own risk!  Long
Long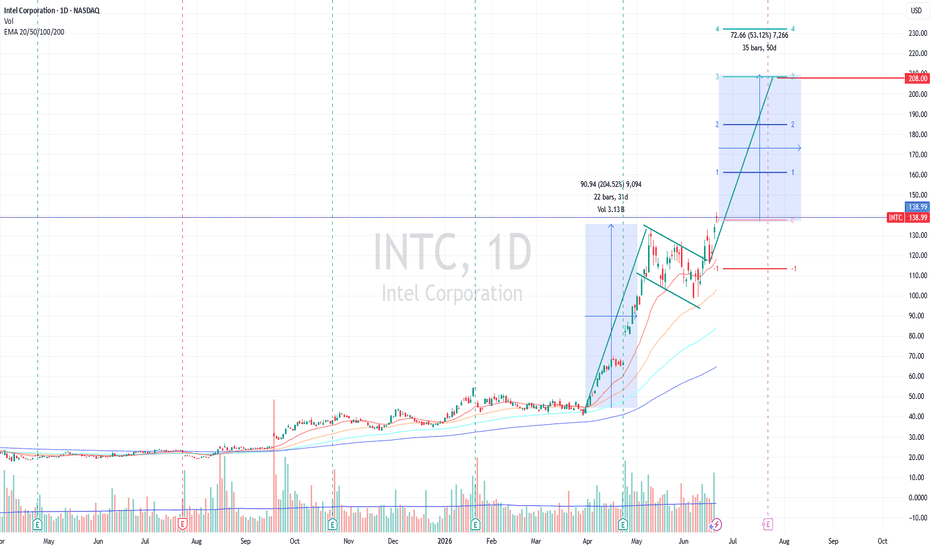
 Long
Long
TRENT: Bull Flag Consolidation with Strong Volume Expansion📊 STWP Equity Snapshot
________________________________________
MARKET STRUCTURE SNAPSHOT | NSE: TRENT | DAILY
________________________________________
• Closing Price: ₹2,901.10 (+₹145.80 | +5.29%)
• Core Trend: Uptrend (Weakening)
• Market State: Bull Flag / Consolidation Structure Under Development
• Price Structure: Strong bullish breakout candle emerging from consolidation support
________________________________________
OPERATIONAL PRICE GRID & KEY REFERENCE LEVELS
________________________________________
• Model Reference Level: ₹2,944.50
• Hard Invalidation Level: ₹2,675.50
• Structural Risk: ₹269.00 (9.14%)
• Resistance Levels: R1 ₹2,966.63 | R2 ₹3,032.17 | R3 ₹3,119.83
• Support Levels: S1 ₹2,813.43 | S2 ₹2,725.77 | S3 ₹2,660.23
• Range Structure: Low ₹2,653.73 | High ₹2,986.27
• Higher Timeframe Observation Zones: ₹3,213.50 | ₹3,482.45
________________________________________
MOMENTUM, PARTICIPATION & CPR DATA
________________________________________
• Volume Profile: 2.23M Shares
• Volume Character: Very High Relative Participation
• RSI Metric: 60.60 (Bullish Momentum Zone)
• ADX Reading: 25.40 (Developing Trend Strength)
• ROC: +4.67%
• MACD Status: Strong Positive Momentum Structure
• Stochastic Reading: 83.39 (Extended Momentum Zone)
• Current Bias: BUY BIAS
• CPR State: Bullish Zone | CPR Moving Up (Narrow)
• Today's CPR: Pivot 2753.20 | Top 2754.25 | Base 2752.15
• Tomorrow's CPR (Projected): Pivot 2878.95 | Top 2890.05 | Base 2867.90
________________________________________
📚 EDUCATIONAL OBSERVATION
________________________________________
Trent has delivered a strong bullish session supported by very high market participation, with volume expanding to approximately 2.23 million shares. The latest candle emerged from a prolonged consolidation phase and reflects renewed buyer dominance near the upper portion of the established trading range. Volume expansion alongside a strong bullish candle often attracts attention because it demonstrates participation behind the move rather than a low-conviction advance.
From a chart structure perspective, the manually annotated chart highlights a developing Bull Flag formation. The sharp advance from the April lows created the flagpole, while the subsequent downward-sloping consolidation channel formed the flag structure. Price has repeatedly respected both the upper and lower boundaries of the pattern, and the latest recovery candle has pushed price back toward the upper boundary of the consolidation zone. This suggests that buyers continue defending higher levels while supply gradually contracts within the pattern.
Momentum conditions remain constructive. RSI has improved to 60.60 and remains comfortably within bullish territory, while MACD continues reflecting positive momentum. ADX has strengthened to 25.40, suggesting improving trend strength, and ROC remains firmly positive at 4.67%. Stochastic readings near 83 indicate strong momentum participation, although they also highlight that price is operating within an extended momentum environment.
The projected CPR for the next session continues to shift higher, with a projected Pivot level of ₹2,878.95. A rising CPR structure generally reflects improving market acceptance of higher prices. The dashboard also maintains a BUY BIAS classification with a bullish CPR structure, supporting the ongoing recovery framework. Immediate attention remains focused on the resistance cluster between ₹2,966 and ₹3,032, while the broader range ceiling near ₹2,986 and the flag resistance line remain key observation zones.
The current structural risk between the Model Reference Level and the Hard Invalidation Level stands at ₹269.00 or approximately 9.14%. This provides context regarding the downside distance available before the present technical structure would require reassessment. Beyond the current consolidation pattern, higher timeframe observation zones remain positioned near ₹3,213 and ₹3,482, representing areas where future market reactions may become relevant.
Support and resistance levels should be treated as observation zones rather than predictive targets. Chart patterns, momentum indicators, volume analysis, and CPR frameworks are educational tools that help market participants understand evolving market structure within a disciplined risk-management framework.
________________________________________
⚠️ Disclaimer
________________________________________
• This analysis is provided strictly for educational and informational purposes.
• This is not financial, investment, or trading advice and should not be considered a recommendation to buy or sell any security.
• Stock market investments are subject to market risks, including the possible loss of capital.
• Past performance, historical observations, chart patterns, and technical indicators do not guarantee future results.
• Please conduct your own research and consult a SEBI-registered financial advisor before making investment decisions.
• STWP assumes no responsibility or liability for any financial loss arising directly or indirectly from the use of this information.
 Long
Long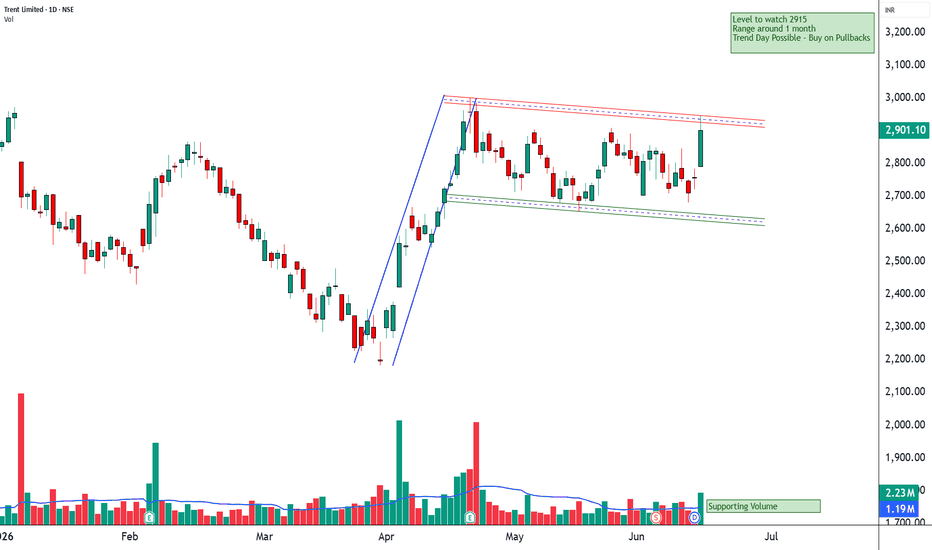
 Long
Long
 Long
Long
 Long
Long
 Long
Long
Tesla Could Be SkiddingTesla tried to rally this spring along with the broader market, but it might be losing traction.
The first pattern on today’s chart is the series of higher lows since early April. The EV giant broke that short uptrend last week, which could be viewed as a bearish flag breakdown.
Second, the 50-day simple moving average (SMA) crossed below the 100-day SMA in February and below the 200-day SMA in April. The 100-day SMA crossed below the 200-day SMA in May. That sequence, with faster SMAs below slower SMAs, could be viewed as evidence of a longer-term downtrend. (See the yellow markings.)
Third, the 8-day exponential moving average (EMA) just slipped under the 21-day EMA. Does that reflect short-term bearishness?
Fourth, Wilder’s Relative Strength Index (RSI) has been trending lower.
Next, Bollinger Band Width has stayed in a tight range. Could that volatility squeeze give way to increased movement?
Finally, TSLA is a highly active underlier in the options market. (Its average daily volume of 3.2 million contracts ranks second in the S&P 500, according to TradeStation data.) That could help traders take positions with calls and puts.
TradeStation has, for decades, advanced the trading industry, providing access to stocks, options and futures. If you're born to trade, we could be for you. Learn more here about TradingView’s Broker of the Year!
Past performance, whether actual or indicated by historical tests of strategies, is no guarantee of future performance or success. There is a possibility that you may sustain a loss equal to or greater than your entire investment regardless of which asset class you trade (equities, options or futures); therefore, you should not invest or risk money that you cannot afford to lose. Online trading is not suitable for all investors. View the document titled Characteristics and Risks of Standardized Options at www.TradeStation.com . Before trading any asset class, customers must read the relevant risk disclosure statements on www.TradeStation.com . System access and trade placement and execution may be delayed or fail due to market volatility and volume, quote delays, system and software errors, Internet traffic, outages and other factors.
Securities and futures trading is offered to self-directed customers by TradeStation Securities, Inc., a broker-dealer registered with the Securities and Exchange Commission and a futures commission merchant licensed with the Commodity Futures Trading Commission). TradeStation Securities is a member of the Financial Industry Regulatory Authority, the National Futures Association, and a number of exchanges.
Options trading is not suitable for all investors. Your TradeStation Securities’ account application to trade options will be considered and approved or disapproved based on all relevant factors, including your trading experience. See www.TradeStation.com . Visit www.TradeStation.com for full details on the costs and fees associated with options.
Margin trading involves risks, and it is important that you fully understand those risks before trading on margin. The Margin Disclosure Statement outlines many of those risks, including that you can lose more funds than you deposit in your margin account; your brokerage firm can force the sale of securities in your account; your brokerage firm can sell your securities without contacting you; and you are not entitled to an extension of time on a margin call. Review the Margin Disclosure Statement at www.TradeStation.com .
TradeStation Securities, Inc. and TradeStation Technologies, Inc. are each wholly owned subsidiaries of TradeStation Group, Inc., both operating, and providing products and services, under the TradeStation brand and trademark. When applying for, or purchasing, accounts, subscriptions, products and services, it is important that you know which company you will be dealing with. Visit www.TradeStation.com for further important information explaining what this means.  Short
Short
 Long
Long