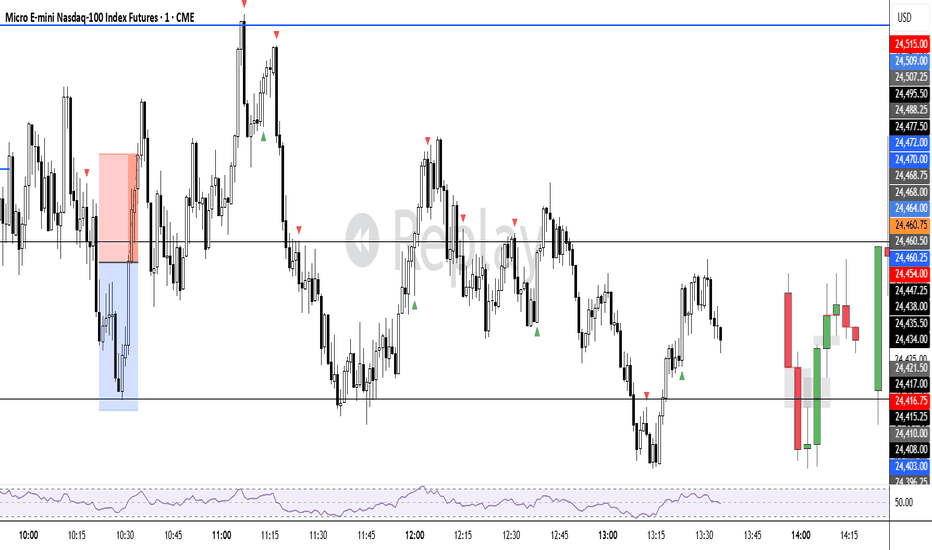
 Short
Short
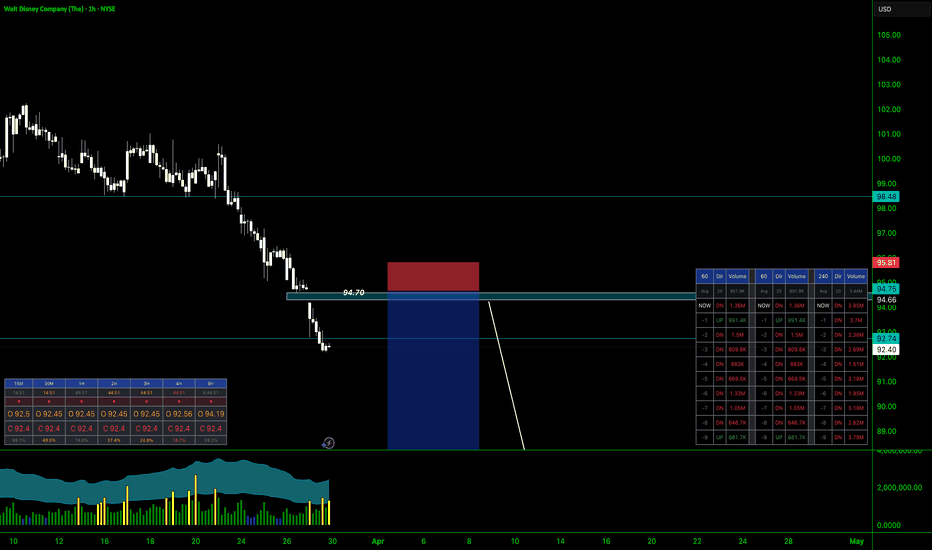
 Long
Long
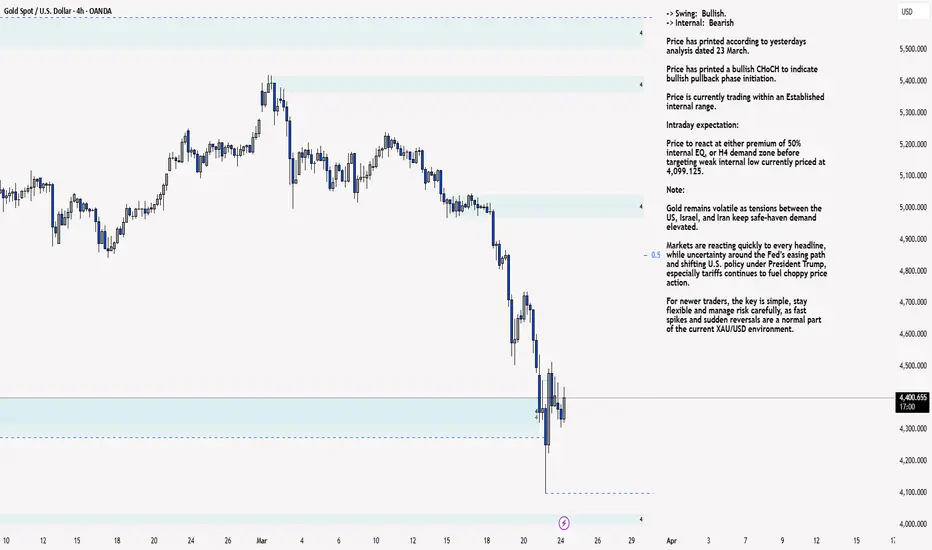
XAU/USD 27 March 2026 Intraday AnalysisH4 Analysis:
-> Swing: Bullish.
-> Internal: Bearish.
Analysis and bias to remain the same as analysis dated 24 March 2026.
Price has printed a bullish CHoCH to indicate bullish pullback phase initiation.
Price is currently trading within an Established internal range.
Intraday expectation:
Price to react at either premium of 50% internal EQ, or H4 demand zone before targeting weak internal low currently priced at 4,099.125.
Note:
Gold remains volatile as tensions between the US, Israel, and Iran keep safe‑haven demand elevated.
Markets are reacting quickly to every headline, while uncertainty around the Fed’s easing path and shifting U.S. policy under President Trump, especially tariffs continues to fuel choppy price action.
For newer traders, the key is simple, stay flexible and manage risk carefully, as fast spikes and sudden reversals are a normal part of the current XAU/USD environment.
H4 Chart:
M15 Analysis:
-> Swing: Bearish.
-> Internal: Bearish.
Analysis and bias to remain the same as analysis dated 23 March 2026.
Price has printed a bearish iBOS and BOS.
Price is currently trading within an internal high and fractal low with CHoCH positioning denoted with a blue horizontal dotted line, however, I shall monitor price with respect to depth of pullback.
Intraday expectation:
Price to print bullish CHoCH to indicate bullish pullback phase initiation, thereafter, price to trade up to either premium of 50% EQ or M15 supply zone before targeting weak internal low priced at 4099.125.
Note:
Gold remains highly reactive on the M15 as geopolitical risk continues to drive quick, headline‑led moves.
The latest tension between the US, Israel, and Iran is keeping safe‑haven demand elevated, with markets still sensitive to any sign of escalation.
At the same time, shifting US tariff policy under President Trump is adding extra uncertainty, fuelling sharp intraday swings and increasing the likelihood of sudden sentiment flips. Liquidity pockets and whipsaws remain common, making disciplined risk management essential.
Gold’s geopolitical premium is still firmly in place, and until tensions ease, short‑term volatility is likely to stay front‑loaded.
M15 Chart: XAU/USD 26 March 2026 Intraday AnalysisH4 Analysis:
-> Swing: Bullish.
-> Internal: Bearish.
Analysis and bias to remain the same as analysis dated 24 March 2026.
Price has printed a bullish CHoCH to indicate bullish pullback phase initiation.
Price is currently trading within an Established internal range.
Intraday expectation:
Price to react at either premium of 50% internal EQ, or H4 demand zone before targeting weak internal low currently priced at 4,099.125.
Note:
Gold remains volatile as tensions between the US, Israel, and Iran keep safe‑haven demand elevated.
Markets are reacting quickly to every headline, while uncertainty around the Fed’s easing path and shifting U.S. policy under President Trump, especially tariffs continues to fuel choppy price action.
For newer traders, the key is simple, stay flexible and manage risk carefully, as fast spikes and sudden reversals are a normal part of the current XAU/USD environment.
H4 Chart:
M15 Analysis:
-> Swing: Bearish.
-> Internal: Bearish.
Analysis and bias to remain the same as analysis dated 23 March 2026.
Price has printed a bearish iBOS and BOS.
Price is currently trading within an internal high and fractal low with CHoCH positioning denoted with a blue horizontal dotted line, however, I shall monitor price with respect to depth of pullback.
Intraday expectation:
Price to print bullish CHoCH to indicate bullish pullback phase initiation, thereafter, price to trade up to either premium of 50% EQ or M15 supply zone before targeting weak internal low priced at 4099.125.
Note:
Gold remains highly reactive on the M15 as geopolitical risk continues to drive quick, headline‑led moves.
The latest tension between the US, Israel, and Iran is keeping safe‑haven demand elevated, with markets still sensitive to any sign of escalation.
At the same time, shifting US tariff policy under President Trump is adding extra uncertainty, fuelling sharp intraday swings and increasing the likelihood of sudden sentiment flips. Liquidity pockets and whipsaws remain common, making disciplined risk management essential.
Gold’s geopolitical premium is still firmly in place, and until tensions ease, short‑term volatility is likely to stay front‑loaded.
M15 Chart: XAU/USD 25 March 2026 Intraday AnalysisH4 Analysis:
-> Swing: Bullish.
-> Internal: Bearish.
Analysis and bias to remain the same as analysis dated 24 March 2026.
Price has printed a bullish CHoCH to indicate bullish pullback phase initiation.
Price is currently trading within an Established internal range.
Intraday expectation:
Price to react at either premium of 50% internal EQ, or H4 demand zone before targeting weak internal low currently priced at 4,099.125.
Note:
Gold remains volatile as tensions between the US, Israel, and Iran keep safe‑haven demand elevated.
Markets are reacting quickly to every headline, while uncertainty around the Fed’s easing path and shifting U.S. policy under President Trump, especially tariffs continues to fuel choppy price action.
For newer traders, the key is simple, stay flexible and manage risk carefully, as fast spikes and sudden reversals are a normal part of the current XAU/USD environment.
H4 Chart:
M15 Analysis:
-> Swing: Bearish.
-> Internal: Bearish.
Analysis and bias to remain the same as analysis dated 23 March 2026.
Price has printed a bearish iBOS and BOS.
Price is currently trading within an internal high and fractal low with CHoCH positioning denoted with a blue horizontal dotted line, however, I shall monitor price with respect to depth of pullback.
Intraday expectation:
Price to print bullish CHoCH to indicate bullish pullback phase initiation, thereafter, price to trade up to either premium of 50% EQ or M15 supply zone before targeting weak internal low priced at 4099.125.
Note:
Gold remains highly reactive on the M15 as geopolitical risk continues to drive quick, headline‑led moves.
The latest tension between the US, Israel, and Iran is keeping safe‑haven demand elevated, with markets still sensitive to any sign of escalation.
At the same time, shifting US tariff policy under President Trump is adding extra uncertainty, fuelling sharp intraday swings and increasing the likelihood of sudden sentiment flips. Liquidity pockets and whipsaws remain common, making disciplined risk management essential.
Gold’s geopolitical premium is still firmly in place, and until tensions ease, short‑term volatility is likely to stay front‑loaded.
M15 Chart:  Short
Short
XAU/USD 24 March 2026 Intraday AnalysisH4 Analysis:
-> Swing: Bullish.
-> Internal: Bearish
Price has printed according to yesterdays analysis dated 23 March.
Price has printed a bullish CHoCH to indicate bullish pullback phase initiation.
Price is currently trading within an Established internal range.
Intraday expectation:
Price to react at either premium of 50% internal EQ, or H4 demand zone before targeting weak internal low currently priced at 4,099.125.
Note:
Gold remains volatile as tensions between the US, Israel, and Iran keep safe‑haven demand elevated.
Markets are reacting quickly to every headline, while uncertainty around the Fed’s easing path and shifting U.S. policy under President Trump, especially tariffs continues to fuel choppy price action.
For newer traders, the key is simple, stay flexible and manage risk carefully, as fast spikes and sudden reversals are a normal part of the current XAU/USD environment.
H4 Chart:
M15 Analysis:
-> Swing: Bearish.
-> Internal: Bearish.
Analysis and bias to remain the same as yesterdays analysis dated 23 March 2026.
Price has printed a bearish iBOS and BOS.
Price is currently trading within an internal high and fractal low with CHoCH positioning denoted with a blue horizontal dotted line, however, I shall monitor price with respect to depth of pullback.
Intraday expectation:
Price to print bullish CHoCH to indicate bullish pullback phase initiation, thereafter, price to trade up to either premium of 50% EQ or M15 supply zone before targeting weak internal low priced at 4099.125.
Note:
Gold remains highly reactive on the M15 as geopolitical risk continues to drive quick, headline‑led moves.
The latest tension between the US, Israel, and Iran is keeping safe‑haven demand elevated, with markets still sensitive to any sign of escalation.
At the same time, shifting US tariff policy under President Trump is adding extra uncertainty, fuelling sharp intraday swings and increasing the likelihood of sudden sentiment flips. Liquidity pockets and whipsaws remain common, making disciplined risk management essential.
Gold’s geopolitical premium is still firmly in place, and until tensions ease, short‑term volatility is likely to stay front‑loaded.
M15 Chart:

XAU/USD 23 March 2026 Intraday AnalysisH4 Analysis:
-> Swing: Bullish.
-> Internal: Bearish
Price did not print according to analysis dated 02 February 2026. This is due to the daily and weekly TF's being in bearish pullback phase.
I will update daily and weekly TF's in weekly analysis.
Price has printed a bearish iBOS.
Price is currently trading within an internal high and fractal low.
CHoCH positioning is denoted with a blue horizontal dotted line.
Intraday expectation:
Allow price to print bullish CHoCH which would identify internal range. Thereafter, price to react at either premium of 50% internal EQ, or H4 demand zone before targeting weak internal low currently priced at 4,099.125.
Note:
Gold remains volatile as tensions between the US, Israel, and Iran keep safe‑haven demand elevated.
Markets are reacting quickly to every headline, while uncertainty around the Fed’s easing path and shifting U.S. policy under President Trump, especially tariffs continues to fuel choppy price action.
For newer traders, the key is simple, stay flexible and manage risk carefully, as fast spikes and sudden reversals are a normal part of the current XAU/USD environment.
H4 Chart:
M15 Analysis:
-> Swing: Bearish.
-> Internal: Bearish.
Price has printed according to my analysis dated 16 March 2026.
Price has printed a bearish iBOS and BOS.
Price is currently trading within an internal high and fractal low with CHoCH positioning denoted with a blue horizontal dotted line, however, I shall monitor price with respect to depth of pullback.
Intraday expectation:
Price to print bullish CHoCH to indicate bullish pullback phase initiation, thereafter, price to trade up to either premium of 50% EQ or M15 supply zone before targeting weak internal low priced at 4099.125.
Note:
Gold remains highly reactive on the M15 as geopolitical risk continues to drive quick, headline‑led moves.
The latest tension between the US, Israel, and Iran is keeping safe‑haven demand elevated, with markets still sensitive to any sign of escalation.
At the same time, shifting US tariff policy under President Trump is adding extra uncertainty, fuelling sharp intraday swings and increasing the likelihood of sudden sentiment flips. Liquidity pockets and whipsaws remain common, making disciplined risk management essential.
Gold’s geopolitical premium is still firmly in place, and until tensions ease, short‑term volatility is likely to stay front‑loaded.
M15 Chart:

 Long
Long