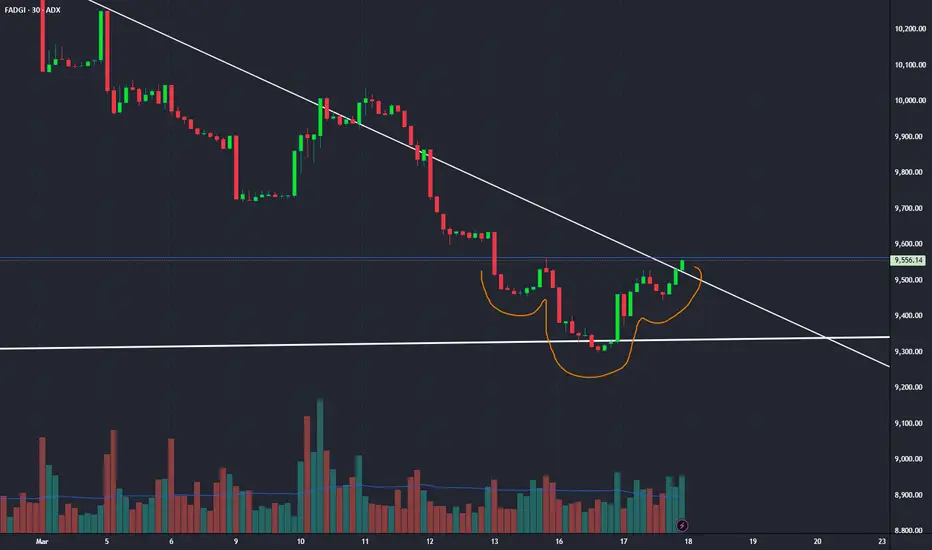
Breakout tomorrow?ADX formed a nice Inverted head and shoulders pattern on the 30 minutes timeframe, confirmed by volume. Many UAE stocks appear to be forming similar patterns. This could be the sign we have been waiting for, that we have reached the bottom of this correction. Will we breakout the neckline and begin our 'long' journey? I hope so!
Head and Shoulders
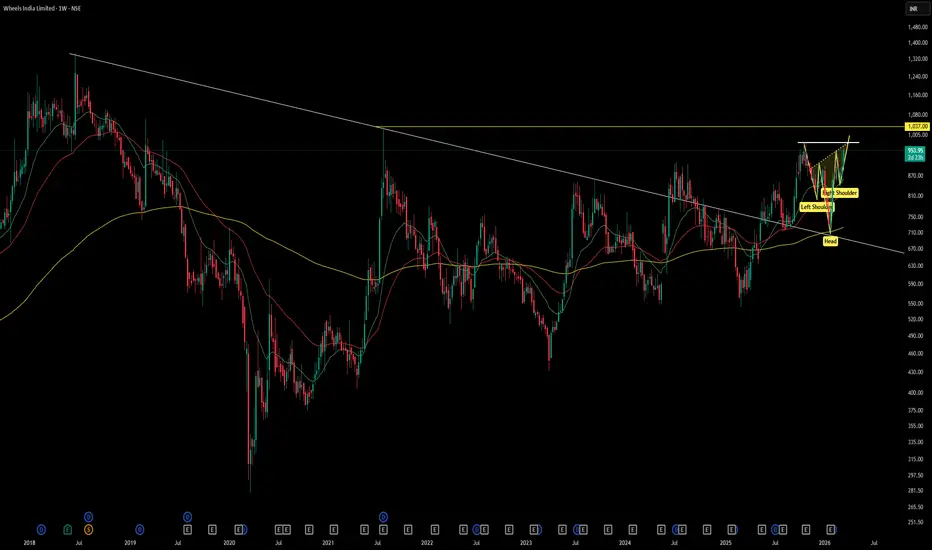
WHEELS INDIAWheels India Ltd. (NSE: WHEELS) is a mid‑cap company in the auto ancillary sector, specializing in steel wheels, castings, air suspension systems, and precision components for commercial vehicles, passenger cars, tractors, and industrial equipment. Incorporated in 1960, it is part of the TVS Group.
Promoter: TVS Group (Promoter Family) – 57.54% holding (Dec 2025)
FY22–FY26 Snapshot
Revenue Growth: CAGR ~8–9% over FY22–FY26, driven by auto demand recovery. → Good
Net Profit: FY26 PAT ~₹210 Cr,
SILVER (XAG/USD): Intraday Bullish SignalIt shows that 📈SILVER has successfully completed a bullish accumulation phase at a significant intraday horizontal support level.
A bullish breakout from the horizontal neckline of an inverted head and shoulder pattern on the hourly chart suggests a clear indication of buyer strength.
Our target 84.00.
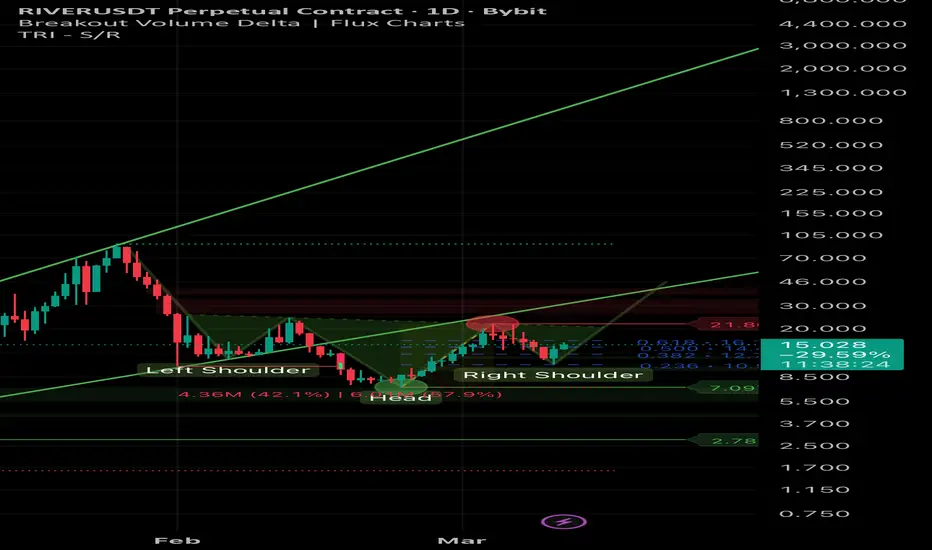
River Analysis (12H)We can all agree about one thing about River, it has finished it's five waved impulsive wave and another A-B-C pattern has been formed right after. We're currently in another five waved impulsive move. Right now, River on stage 3, which means there's still lots of room to go.
As the matter of fact, River also has a visible inverse head and shoulders pattern formed at the moment which is supporting the idea about a new five waved move.
Minimum Target is $66, see you at there!
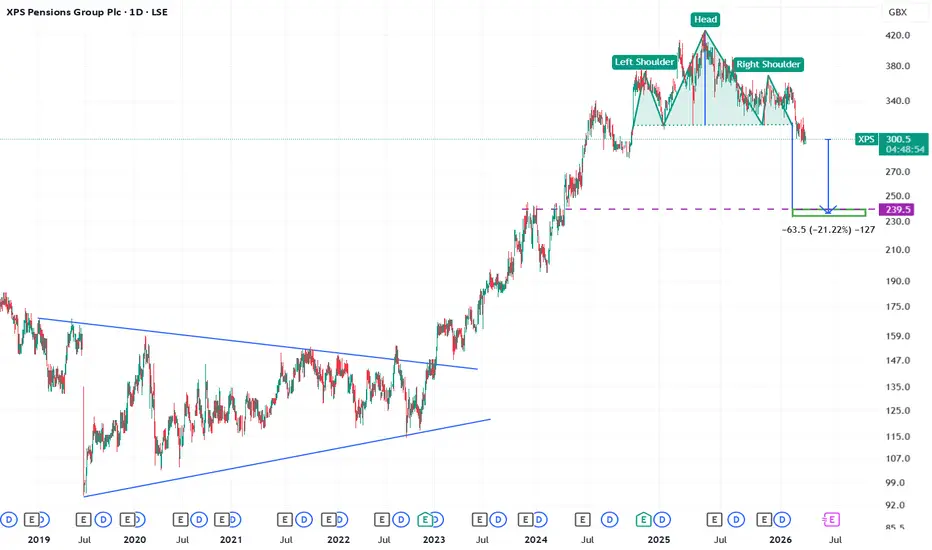
XPS to move lower - Head & Shoulders - bearish Bearish
Here are the main reasons XPS Pensions Group (LSE: XPS) could move lower, ranked most important first:
High valuation relative to earnings – The stock trades on a relatively high P/E multiple (around mid-20s) compared with many UK companies, so if growth expectations weaken the share price can fall.
Slower expected earnings growth – Forecast growth for the company is relatively modest compared with the wider market, which can reduce investor enthusiasm.
Profit decline despite revenu
Head & Shoulders triggered Bearish looks to move lower
Key Risks That Could Push JPMorgan (JPM) Lower
1️⃣ Rising expenses and investment spending
JPM expects ~$105B in expenses for 2026, above previous estimates.
Higher spending on AI, branches, marketing, and compensation could pressure margins.
2️⃣ Economic slowdown / credit cycle risk
If the economy weakens, banks face:
higher loan defaults
lower lending demand
reduced investment banking activity.
3️⃣ Interest-rate cycle turning
JPM benefited from high inte
H & S set up - looks to move lower Bearish
H&S already triggered
1️⃣ Overextended price after strong rally
Airtel has had a long multi-year uptrend.
If momentum slows, profit-taking from institutions could trigger a correction.
2️⃣ High valuation relative to telecom peers
Airtel trades at premium multiples because of strong growth expectations.
If growth or ARPU expansion slows, the valuation could compress.
3️⃣ Heavy capital spending for 5G and spectrum
Airtel continues large investments in network infrastructure.
Hi
Asian Paints: Breakdown toward ₹938🎨🎨🎨
The Technical Setup: A 5-Year Head & Shoulders Top
The Neckline Snap: The crucial support zone at ₹2,700–₹2,800—which held the stock up for years—has been decisively broken.
The Breakdown: We are currently seeing a "retest and reject" move. The price is sliding down the right shoulder with increasing momentum.
The Targets: * Log Target: ₹1,424 (A massive mean-reversion move).
Linear Projection: ₹938 (The ultimate "worst-case" capitulation zone).
Why the "Paints" Narrative is Fading (B
XAUUSD Short: Forms Head and Shoulders - Bears Target $5,000Hello traders! Here’s my technical outlook based on the current XAUUSD (2H) chart structure. Gold previously moved inside an ascending channel, where buyers maintained control and the market consistently formed higher highs and higher lows. During this bullish phase, price respected the rising support line until momentum weakened and the market transitioned into a sideways range, signaling temporary balance between buyers and sellers.
Currently, price is trading under a descending trend line an
The Coming EU Recession into 2028, Mercedes BENZ $MBG Triple TopThe principal pillar of the European economy is Germany, recognized as its wealthiest nation.
A parallel can be drawn to the adage regarding America: when it experiences a minor setback, the global economy often faces significant repercussions.
It is often asserted that the essence of "Deutschland" is deeply rooted in its automotive industry, leading to its moniker as "Autoland." German automobiles have consistently been esteemed as the finest globally.
In fact, the most thriving economic en
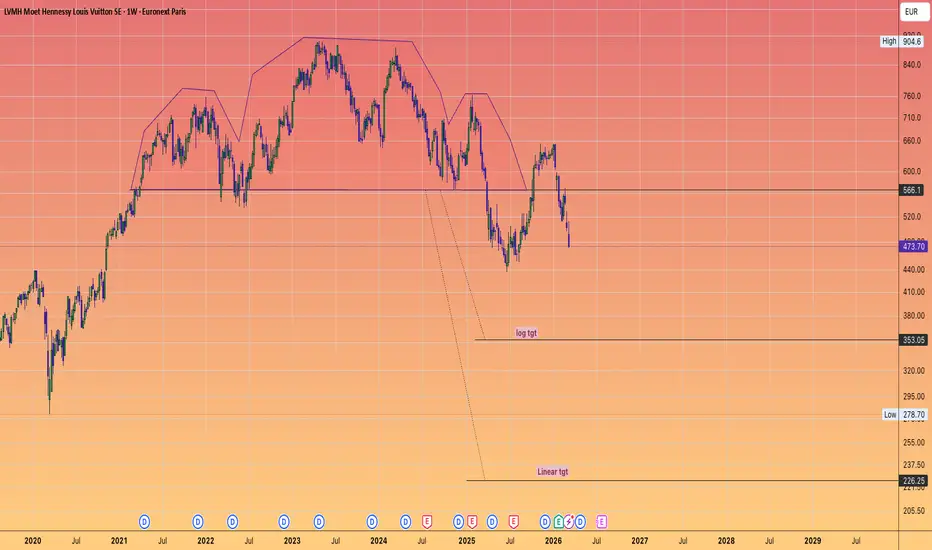
$LVMH: The End of the Luxury Super-Cycle?🥂🛑
Are the rich starting to feel the pinch?
The "SaaSpocalypse" discussed in IT has a luxury equivalent: Ubiquity Fatigue.
The "Aspirational" Collapse: The middle-to-high earners (the "HENRYs" — High Earners, Not Rich Yet) have been decimated by inflation and interest rates.
They were the volume drivers for entry-level Louis Vuitton and Dior. That engine is now cold.
The "Quiet Luxury" Pivot: The ultra-wealthy are moving away from loud, logo-heavy brands (which LVMH dominates) toward "Hyper
NZD/USD about to COLLAPSE - MAJOR EVENT COMINGLook at this multi decade head and shoulders pattern. If this thing breaks the 2020 Covid lows it is going to rapidly sell off to .5000.
This is a beautiful setup. Major confluence of long term historical support levels are just below .5000. I would buy it up once it gets there and potentially take it back up to .55
$NTR: Nutrien Fertilizer. Poop-ular chart setup!Nutrien shows a nice bear to bull reversal, inverse head and shoulders.
It has already broken out from the neckline where I perceive it to be.
Technical confirmation: Holding the $60.87 level.
Two bullish targets provided. Linear and Log (as always)
Fundamental driver: Global price inflation in grains and soft commodities boost fertiliser demand
- potash and nitrogen prices up 15-20% YTD amid supply crunch.
Unpredictable weather and further trade tensions (EU - LatAm, US-China) could spike
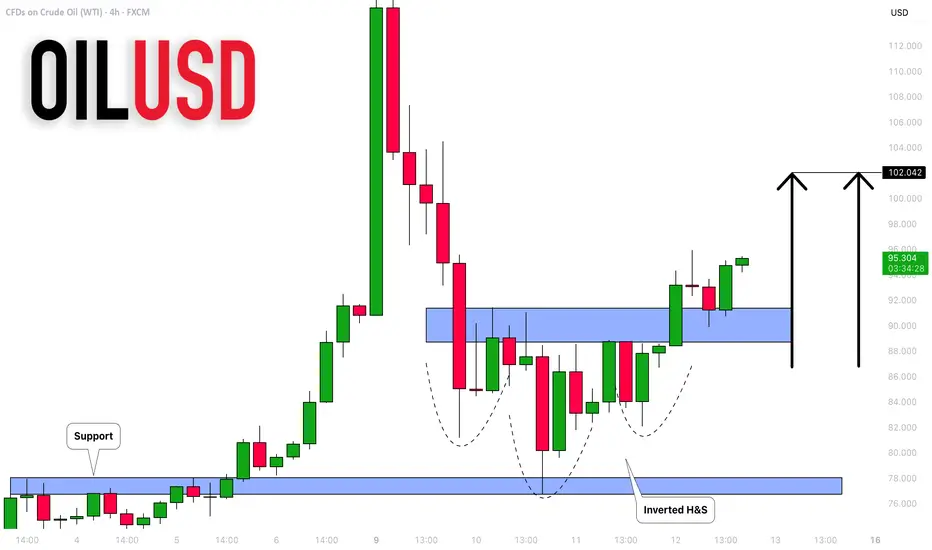
CRUDE OIL (WTI): Another Bullish Wave Ahead?!
It looks like WTI Crude Oil completed a bullish accumulation
on a key intraday horizontal support.
A bullish breakout of a horizontal neckline of an inverted head
and shoulder pattern on a 4H indicates a clear strength of the buyers.
Goal - 102.0
❤️Please, support my work with like, thank you!❤️
I am part of Trade Nation's Influencer program and receive a monthly fee for using their TradingView charts in my analysis.
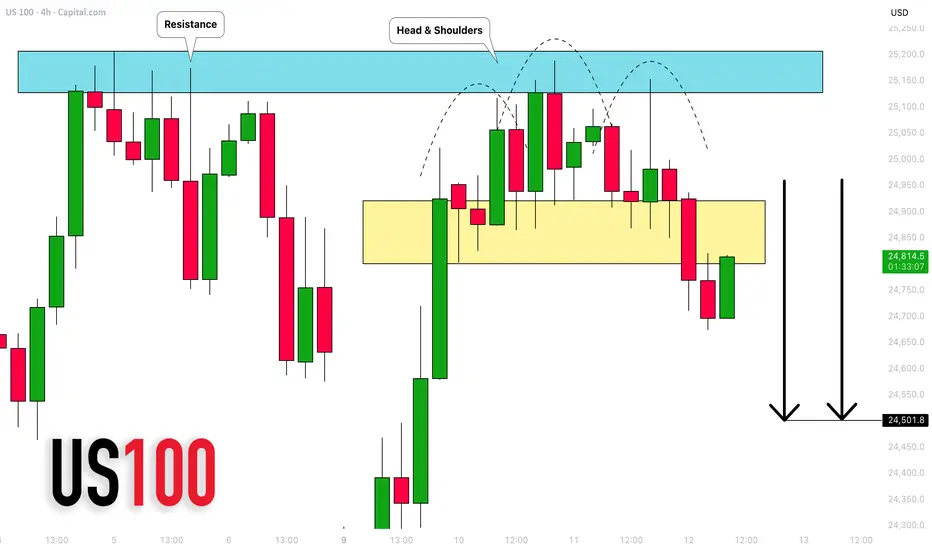
NASDAQ INDEX (US100): Strong Bearish Pattern
There is a high probability that US100 will drop lower,
following a confirmed breakout of a horizontal neckline
of a head & shoulders pattern on a 4H.
Goal - 24500
❤️Please, support my work with like, thank you!❤️
I am part of Trade Nation's Influencer program and receive a monthly fee for using their TradingView charts in my analysis.
CRUDE OIL (USOIL): Confirmed Bullish Continuation Buy!📈USOIL has formed a well-defined inverted head and shoulders pattern on an intraday chart.
A bullish breakout of its neckline is a strong bullish continuation signal.
We could anticipate further growth, potentially reaching the 98.00 level in the near future.
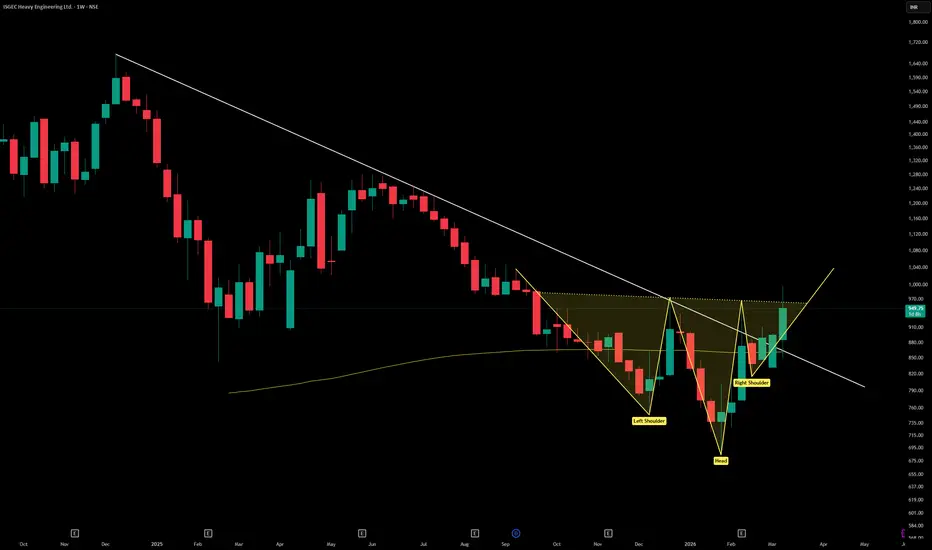
ISGEC HEAVY ENGINEERINGISGEC Heavy Engineering Ltd. (NSE: ISEG) is a diversified capital goods and heavy engineering company, incorporated in 1933. It manufactures boilers, sugar machinery, process equipment, presses, contract manufacturing solutions, and executes EPC projects across India and abroad.
Promoter: Indian Promoter Group – 62.43% holding (Dec 2025)
FY22–FY26 Snapshot
Revenue Growth: CAGR ~11% over FY22–FY26, driven by EPC contracts and industrial equipment demand. → Good
Net Profit: FY26 PAT ~₹420 Cr, r
CPI Holds Disinflation Trend as EUR/USD Tests Inverse H/STechnical Setup – EUR/USD
EUR/USD appears to be forming an inverse head-and-shoulders pattern, a classic bullish reversal structure.
Structure:
• Left shoulder: early March
• Head: recent lows near 1.150
• Right shoulder: currently forming
The key level to watch is the neckline near 1.165.
A break above this level would confirm the pattern and could open the door for a move toward 1.175, which is the next resistance area traders are watching.
If inflation continues trending lower and U.S. y