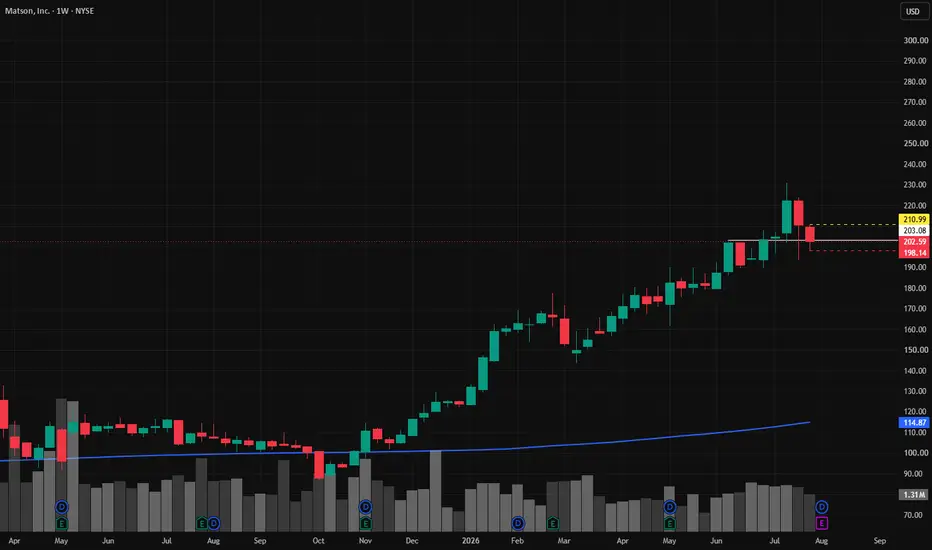
Long
Long
GOLD (XAUUSD) – FULL DAY ROADMAP SEPT 03Bias: 📉 Bearish (fade rallies, target 4,361)
Timeframe: 15m – 1H
📊 THE SETUP
Gold is at 4,383. The market is range-bound with a downward pull toward 4,361. Price is above that level, so gravity is down.
Expected range today: 4,338 – 4,428 (±45 pts)
🛠️ TODAY'S PLAYS
Trade 1 (Best Setup)
Sell at 4,415
Target: 4,383 → 4,361
Stop: Above 4,420
Trade 2 (If We Drop)
Buy at 4,350 (only if it holds)
Target: 4,383
Stop: Below 4,345
Trade 3 (Breakdown)
Sell if price breaks below 4,361
Target: 4,350 → 4,328
Stop: Above 4,370
Trade 4 (Breakout)
Buy if price breaks above 4,415
Target: 4,427 → 4,448
Stop: Below 4,404
🚨 WHAT INVALIDATES THIS
If This Happens Do This
Close above 4,420 Cover shorts – breakout is real
Close below 4,345 Cover longs – breakdown is real
Volume doubles Follow the direction of the volume
⚠️ DISCLAIMER
This is not financial advice. Trading is risky. Use stops and proper size. This is just a roadmap based on dealer positioning and market structure.
Good luck today. Trade the edges, not the magnet.  Short
Short
BTCUSD: 81.4K Liquidity Sweep + Fresh 4H SELL SignalBTC has swept buy-side liquidity above the previous $81,255 high, reaching approximately $81,455, but buyers were unable to hold the breakout.
The rejection was followed by strong bearish displacement and expanding volume. My Swing Signals & Structure indicator then generated a fresh 4H FAST SELL signal at $77,557 on August 28.
At the time of this update, BTC is trading around $78.2K, so this remains an OPEN setup rather than a completed move.
My primary expectation is a short-term bearish correction.
The first important area is $77.6K–$76.9K. BTC has already reacted around this liquidity zone, but a confirmed 4H break below $76.9K would increase the probability of continuation toward:
$75.6K — structural support
$73.2K — T1
$63.8K — extended T2 if the higher-timeframe structure also breaks
The important resistance area is around $79.5K–$80K.
The bearish setup remains valid while BTC stays below $81,623. A break above that level would invalidate the current 4H SELL structure.
One important point: the 6H structure is still stronger than the 4H. The previous 6H QUALITY BUY appeared around $64,280 and captured the major rally toward $81K.
Because of that, I currently see this as a 4H bearish correction rather than confirmation of a major Bitcoin top.
Bias: BEARISH / CORRECTION
Timeframe: 4H
Invalidation: $81,623
Primary Target: $73,209
#BTC #Bitcoin #BTCUSD #MarketStructure #PriceAction  Short
Short
 Short
Short
EURUSD: Bullish Push to 1.1796?FX:EURUSD is eyeing a bullish continuation on the 4-hour chart , with price approaching a key support zone near the upward trendline after recent consolidation, converging with a potential entry area that could ignite further upside momentum toward the higher resistance zone if buyers defend amid volatility. This setup suggests a solid rally opportunity with more than 1:3.5 risk-reward .🔥
Entry between 1.1585–1.1614 (entry from current price with proper risk management is recommended). Target at 1.1796 . Set a stop loss at a daily close below 1.156 , yielding a risk-reward ratio of more than 1:3.5 . Monitor for confirmation via a bullish candle close above entry with rising volume, leveraging the pair’s strength near support.🌟
Fundamentally , EURUSD is trading around 1.166 in late August 2026.
For the Euro, one of the most important releases this week (25–28 August) is the ECB Monetary Policy Meeting Accounts on Thursday, August 27, which will provide key insights into the ECB’s policy outlook.
For the US Dollar, the standout event is the US Core PCE Price Index (July) on Wednesday, August 26 — the Federal Reserve’s preferred inflation gauge that can significantly influence dollar direction. 💡
📝 Trade Setup
🎯 Entry (Long):
1.1585 – 1.1614
(Entry from current price is acceptable with proper position sizing and strict risk management.)
🎯 Target:
1.1796
❌ Stop Loss:
Daily candle close below 1.1560
📈 Risk-to-Reward:
More than 1:3.5
💡 Will buyers defend the 1.1585–1.1614 support zone and push EURUSD toward 1.1796, or will stronger US inflation data derail the bullish structure? 👇  Short
Short
 Short
Short
Long 
Long 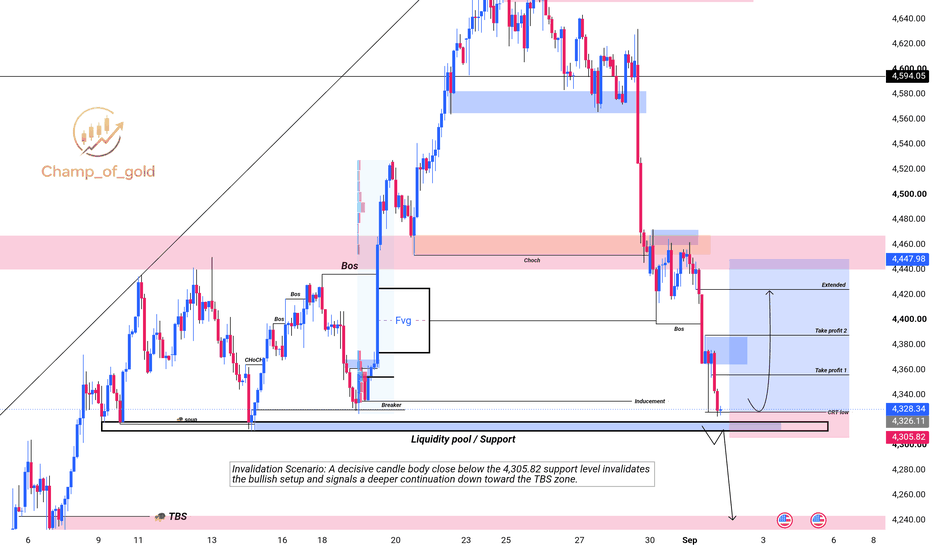
 Long
Long
Long 
XPeng (XPEV) – Key decision levelNYSE:XPEV
XPeng is positioning itself as a leading global Physical AI company. Beyond electric vehicles, the company is developing three additional directions: robotaxis, IRON humanoid robots, and autonomous driving technologies.
I want to share my view on the technical picture of the stock, which is now approaching the most important point of its long-term cycle. Looking at history, back in 2003–2004 this range acted as strong resistance, which later, after breaking upward, turned into key support. Now we are seeing a classic mirror level playout.
A grid has been drawn from the all-time high to the low. The key level lands exactly at $10.53. This confirms that the $9.70–$10.53 range is the strongest zone where major decisions will be made. Price is currently drifting down toward the upper boundary of this area, and this is where I plan to assess the next moves for the coming months.
The technical slowdown near the zone is backed by strong fundamentals. On September 1, XPeng released August delivery data: 39,107 vehicles, up 4% year-over-year. Cumulative deliveries since the start of the year have exceeded 1.2 million units.
In August, the company received approval for remote testing of autonomous vehicles without a safety driver on designated roads in Guangzhou – a key step toward full commercial robotaxis.
On August 24, XPeng's robotics division announced it had raised over $900 million – the largest single round in China's embodied AI sector. The round was led by IDG Capital , with Tencent and Alibaba as strategic investors, and Gaorong Ventures also participating. The post-money valuation of the division reached $6.3 billion. IRON will enter mass production by the end of 2026, with commercial deliveries to customers starting in 2027. XPeng retains a controlling stake in the division.
Large capital is not rushing to exit the stock amid these transformations. The current drift toward support is happening on declining trading volumes – a clear signal of seller exhaustion. Additionally, around 6% of shares are currently shorted. If a confident buyback begins from this zone, sellers will be forced to cover their positions, technically accelerating the upside impulse.
Important context: on the day of the $900 million funding announcement, the stock fell 8.5% on volume 16.3 times above average. The market reacted to potential dilution rather than the substance of the deal. This divergence between market reaction and fundamental value is what creates the current technical opportunity.
The trading plan is as follows. The $9.70–$10.53 range is the main zone of interest for position building. If price holds within these boundaries and shows a reversal impulse above $12.00, a solid medium-term opportunity will open with a first target of $15.99 and a second target of $21.46. If the zone is broken to the downside and price closes below $9.70, the upside scenario would be completely invalidated.
This publication is for analytical purposes only and does not constitute individual investment advice. Share your thoughts in the comments and don't forget to support the idea with a like if you found the analysis useful!  Long
Long
4-Hr Last Gasp for Silver? I just published my bearish outlook for Silver that is in play.
I'm publishing this chart as the bullish antithesis to that weekly chart. If silver were to invalidate the weekly chart, it needs to start it's chance right now.
Our Fub extensions show that silver has returned to the 0.236 level, indicating an automatic re-entry long on this chart. This Fib extension was clean, surpassing one internal and one external peak. It then took out a second external peak in the rally. That's a fairly decent move and a good chart. I hesitate because the ferocity with which it took out the the same levels to the downside usually doesn't indicate good things.
However what gives me a sliver of hope is that the pattern setup within the past week or two looks like a Mountain/Valley Bridge, one of my favorites. It probably has an official name somewhere but I don't know it. When there is a nearly vertical move, followed by a nearly horizontal consolidation, followed by a nearly equal vertical move in the opposite direction this gives me the Mountain/Valley Bridge. Like a bridge strung between two mountain peaks or at the bottom of a valley. Silver ran up, went sideways almost perfectly, tried to escape during Jackson Hole and got pounded straight down. This sets up the Bridge. The question is did the Jackson Hole spike up invalidate the pattern? Usually the bridge will have semi-equal legs up and down, and then the price will rebound to take out the bridge. If that's the case then I expect silver to get through $72.91 in the next two weeks or so.
This Bridge along with the Fib give me a clear entry and stop-loss setups. Losing $63.26 will show that both the Fib and the Bridge failed and it is likely that silver continues lower, as shown in my weekly chart.
The Fib entry was $65.68 while the Mountain Bridge entry would be around $64.50 (there is no exact number). If we wanted confirmation of both we could use a regular Fib extension which would put an entry at around $66.31 as of the current low ($64.54) which would become our stop-loss upon entry.
We would be looking for $73.00 as the profit target.  Long
Long
 Long
Long
 Long
Long