Short
Short
Nifty Analysis EOD – July 8, 2026 – Wednesday 🟢 Nifty Analysis EOD – July 8, 2026 – Wednesday 🔴
News Panic Nosedive: Nifty Sheds 500 Points, Tests 23,800 Support
🗞 Nifty Summary
After the expiry shockwave, another geopolitical shockwave pushed Nifty to gap down 111 points. The opening formed an 88-point IB range, and till 1:40 PM, price stayed inside that range — the rest of the move was purely news-driven.
Around 1:40 PM, fear triggered a sharp 411-point fall, testing 23,805 — the previous week’s low. By the end of the day, the index closed at 23,897.02, recovering 92 points off the low, and the adjusted close came in at 23,882.05, 52 points above the previous week’s low.
Today’s close is almost back to 30 June 2026 levels, which means the previous 8 sessions’ gains got wiped out in just 2 sessions — in fact, 400 points were lost within just 65 minutes.
Nothing technical to discuss here — today’s action was totally news-panic driven, so it might be worth waiting and letting things settle for a while.
The Weekly chart is showing a rare Megaphone pattern, refer to the chart attached below.
Interestingly, there’s also a coincidence on the daily chart — the 11 March 2026 Wednesday candle and today’s candle formed at almost the same level with a similar range.
🛡 5 Min Intraday Chart with Levels
📉 Daily Time Frame Chart with Intraday Levels
🕯 Daily Candle Breakdown
Open: 24,259.55
High: 24,300.00
Low: 23,805.20
Close: 23,882.05
Change: −516.65 points (−2.12%)
🏗️ Structure Breakdown
Type: Strong Bearish — sellers stayed in control from open to close
Range: ≈ 494.80 points — very high volatility
Body: ≈ 377.50 points — most of the day’s move came from real selling, not just noise
Upper Wick: ≈ 40.45 points — barely any rejection near the high
Lower Wick: ≈ 76.85 points — some demand showed up near the lows, a bit of buying support there
🛡 5 Min Intraday Chart
⚔️ Gladiator Strategy Update
ATR: 262.67
IB Range: 88.05 → Small
Market Structure: Imbalanced
Trade Highlights:
9:41 Long Trade: Target Hit (R:R 1:1.99)
10:44 Short Trade: Target Hit (R:R 1:2.14)
Trade Summary: Both trades this morning hit target, but I do regret missing the afternoon’s biggest move, since I was away from the desk for a family emergency. Can’t control everything; might not be lucky enough to capture once in a lifetime opportunity… :(
🧠 Final Thoughts
“Some days the market doesn’t test your strategy, it tests whether you’re even in the room.”
Today wasn’t about levels or patterns — it was news doing all the talking. The 411-point fall in under an hour showed how fast things can move when fear takes over.
Days like today are a reminder that news can undo weeks of setup in minutes, so staying flexible matters more than being right. Tomorrow I’ll be watching to see if the panic settles or if there’s more to come.
✏️ Disclaimer
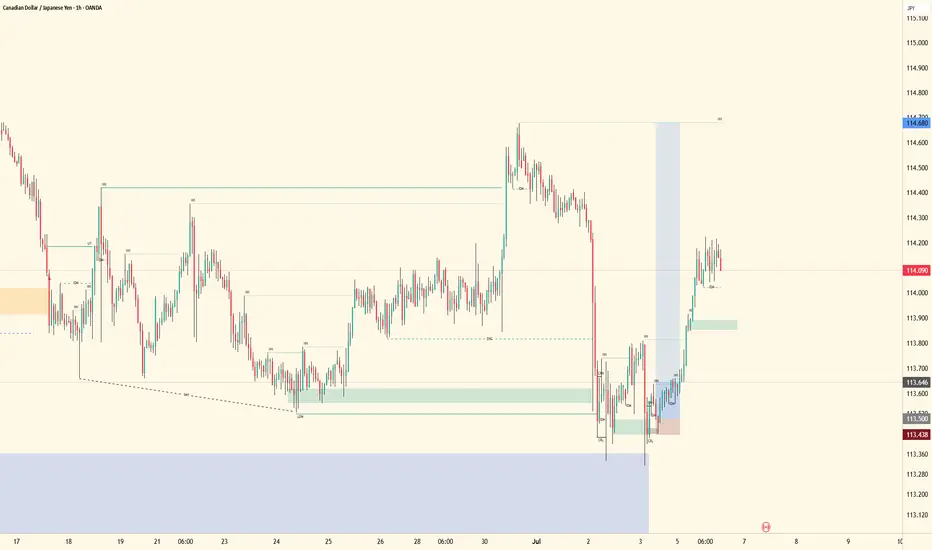
This is my personal digital diary and represents my own analysis and point of view. It is not financial advice; please consult a professional advisor before making any trading decisions. CADJPY - Higher Time Frame Bullish ContinuationThe higher time frame remains bullish, confirmed through top-down structure analysis.
Price has already broken key higher time frame levels, creating a displacement away from prior highs. From there, mid-term liquidity was taken as price engineered internal inducement and delivered into the last Point of Interest within the range, reacting within the auction area.
This move also swept higher time frame inducement levels and mitigated the higher time frame bullish order block (primarily through wick reaction rather than full acceptance). This suggests liquidity was taken, but bullish intent remains intact.
From a mid-term perspective, price has now shown lower time frame trend change. Minor structural breaks have occurred, forming a new high and shifting momentum back in favor of buyers.
On the lower time frame, price continued to engineer liquidity within the bullish leg, rebalance inefficiencies, and mitigate the most recent auction zone within the green range. The lows delivered a clean sweep, aligning with the liquidity model and supporting the bullish continuation thesis.
From here, price is now targeting lower time frame highs. If those levels are taken, I will continue to follow momentum in line with the existing higher time frame trend.
If price invalidates this structure, I will reassess based on the next liquidity event and re-map accordingly. No bias—only reaction to data.
Overall target remains unchanged: higher time frame and mid-term highs.
Patience is key. Track structure, follow liquidity, and let price confirm continuation before expansion.
 Long
Long
 Long
Long
AUDCAD | Walking Through My Trade Process: From Bias To EntryFirst video breakdown, so the quality and delivery won’t be perfect, but the goal is to show the process and give a walkthrough of how I’m approaching this setup.
In this breakdown, I’m showing how I go from higher timeframe analysis down into lower timeframe confirmation and what I’m looking for before taking an entry.
Starting with the bigger picture, AUDCAD is showing bullish structure with price continuing to respect higher highs and higher lows. From there, I’m tracking how price interacts with key liquidity areas, inducement levels, and potential accumulation zones.
As price developed, we saw liquidity being taken, engineered, and eventually a return back into the area of interest. After mitigation and confirmation, I waited for lower timeframe structure to shift before looking for continuation.
The focus was not on forcing a trade, but allowing price to build the story:
● liquidity being created and taken
● structure shifting
● order flow being respected
● displacement confirming intent
This video is simply a walkthrough of my thought process and the steps I’m looking for before entering a position.
Still improving the videos and delivery over time, but the mission stays the same:
Patience is key. Tracking remains the edge. 📈
EOSE 1W: Zinc, Texas and Big Money (Update)NASDAQ:EOSE
While the world argues about lithium, Eos Energy quietly built a business on zinc. It does not catch fire, does not depend on China, and holds a charge for up to 12 hours. That is exactly what overloaded American grids and data centers need. The company trades on NASDAQ.
Q1 2026
On May 13, the company published results that flipped the consensus. Revenue came in at $57 million, up 445% year over year, with production volume growing 5.7x. The headline surprise was EPS: +$0.12 against analyst expectations of -$0.22, a 154% positive beat and one of the largest in the reporting season. Factory automation finally started delivering real returns. Cash on the balance sheet stands at $472 million, full year guidance reaffirmed at $300–$400 million, with analysts projecting $600 million by 2027.
Frontier Power USA
Alongside the earnings release, Eos announced the creation of Frontier Power USA, a standalone project company for building and operating energy storage systems using Eos Z3 batteries. Eos holds 49%, with financing fully ring-fenced from the corporate balance sheet. Cerberus Capital anchored the platform with a $100 million commitment, Hudson Bay Capital added $125 million. Total equity commitments to the platform reached $375 million. On June 30, Frontier Power selected four Texas projects under the ERCOT market - Blanquilla, Aransas Pass, Nash and Wallis - totaling 230 MW / 920 MWh under the Stella Energy Solutions platform.
Rights Offering
On July 2, Eos launched a rights offering targeting $150 million from existing shareholders. Rights began trading on NASDAQ under the ticker EOSER on July 6, with warrants under EOSEW. Subscription price is $5.481 per unit, approximately a 10% discount to the June 29 closing price. The arbitrage between the rights and the underlying stock created technical selling pressure on EOSE, which institutional participants are using to build positions. The offering expires July 21.
Risks
The company remains EBITDA negative. Covenants with Cerberus take effect in Q1 2027, creating a hard deadline for reaching operational breakeven. The class action lawsuit Yung v. Eos Energy in the Federal District Court of New Jersey alleges management concealed production failures at the Thorn Hill facility, where equipment downtime reached 30–35% and bipolar plate defects pushed delivery schedules back five weeks.
Technicals - Weekly Timeframe
After an impulsive rally from the historical low, price entered a deep corrective phase and is now testing the confluence zone at 4.04–4.44, where the OTE level, the 200-period moving average, and a bullish FVG all converge. This week volume surpassed 83 million shares, with 55 million traded on the July 7 session alone, closing at $4.74. That kind of volume concentration on bearish candles near structural support is a classic selling climax signature. Weekly Stochastic has dropped below 20 and is beginning to turn. First target $9.37, second $14.40.
A $150 million rights offering, $375 million in institutional capital entering a project vehicle, and an anomalous volume spike at key support rarely line up at the same time. The market is offering an entry price that large participants are clearly using to their advantage.  Long
Long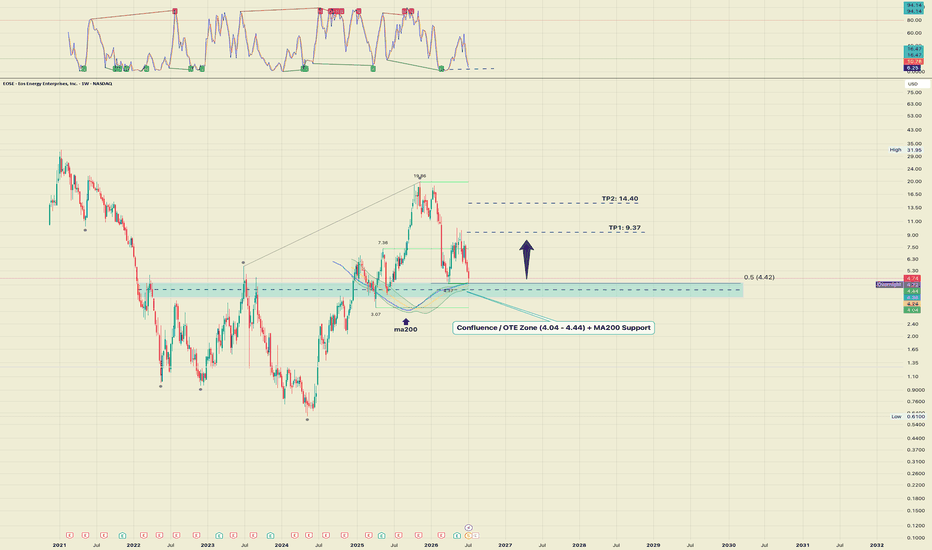
 Short
Short
 Long
Long
 Long
Long
 Long
Long
 Long
Long
 Long
Long
 Long
Long
Nifty Analysis EOD – July 7, 2026 – Tuesday🟢 Nifty Analysis EOD – July 7, 2026 – Tuesday 🔴
Gap, Grind, Give Back: Nifty Touches 24,530 Then Fades to 24,398
🗞 Nifty Summary
Nifty gapped up 47 points above the PDH, opening with continuous bullish sentiment. After the first tick, it filled the gap and found a base near PDC, marking the day low almost exactly at that level.
From there, Nifty climbed gradually, breaking above PDH, 24,480, IBH, and 24,500 ~ 24,510, eventually marking the day high at 24,530.70. After hovering above 24,500 for close to an hour, it failed to push any higher. Around 12:10 PM, price came down below the trendline and started falling sharply, losing 111 points from the day high and testing the IBL ~ PDC level.
From that level it tried to build a base and managed a 50-point recovery, reaching VWAP — where selling pressure came in again and pushed Nifty down another 122 points, taking it to the 24,350 support level. The day closed at 24,355.10 without much of a bounce back, though the adjusted close came in at 24,398.70, about 50 points above the day low.
The daily candle closed bearish with wicks on both sides, reflecting a moderate-volatility, somewhat indecisive finish after the intraday swings.
Overall the day gave opportunities on both sides, with high volatility likely tied to expiry-day adjustments. Bullish sentiment might continue tomorrow — today marked the 6th consecutive day forming an HH-HL structure — but the rejection from 24,500 looks like this momentum could be fading. 24,285 ~ 24,235 is the level to watch; a break there might be an early sign to observe in tomorrow’s session.
🛡 5 Min Intraday Chart with Levels
📉 Daily Time Frame Chart with Intraday Levels
🕯 Daily Candle Breakdown
Open: 24,464.45
High: 24,530.90
Low: 24,348.95
Close: 24,398.70
Change: −31.65 (−0.13%)
🏗️ Structure Breakdown
Type: Bearish candle with wicks on both sides — a pullback from the highs with sellers slightly ahead
Range: ≈182 points — moderate volatility
Body: ≈65.75 points — sellers had the edge, but not by a wide margin
Upper Wick: ≈66.45 points — rejection showing up near the day high
Lower Wick: ≈49.75 points — some demand stepping in near the day low
🛡 5 Min Intraday Chart
⚔️ Gladiator Strategy Update
ATR: 225.92
IB Range: 64.95 → Small
Market Structure: ImBalanced
Trade Highlights:
09:42 Long Trade: Target Hit (R:R 1:1.52)
11:00 Long Trade: Target Hit (R:R 1:1.23)
12:13 Short Trade: Target Hit (R:R 1:2.31)
13:39 Short Trade: SL Hit
14:59 HERO ZERO Trade: Target Hit (R:R 1:6.2)
Trade Summary: Four out of five trades hit target today, with both longs early and the shorts after the reversal working out well. The Hero Zero trade in the last hour was the standout, closing out the session on a strong note. Days like this remind me why sticking to the system matters more than trying to predict every swing.
🧱 Support & Resistance Levels
Resistance Zones: 24460 | 24500 ~ 24520 | 24600
Support Zones: 24285 ~ 24235 | 24160 | 24125
🧠 Final Thoughts
“A gap can open the door, but it’s the follow-through that decides who walks through it.”
What stood out today was how quickly the rejection came once 24,500 was tested — six days of higher highs and higher lows, and the first real sign of hesitation showed up right there.
If 24,285 ~ 24,235 holds, the broader up move could still be intact, but a break below that zone might be the first real crack in this run. On the upside, 24,500 ~ 24,520 and 24,600 are the zones I’m watching for any fresh push higher.
Expiry days test patience more than strategy, and today was no exception. Sticking to the plan through both the rally and the fade felt like the right call, and that’s really all I can ask of myself.
✏️ Disclaimer
This is my personal digital diary and represents my own analysis and point of view. It is not financial advice; please consult a professional advisor before making any trading decisions.  Long
Long
 Long
Long
 Long
Long
AUDJPY - HTF Bullish ContinuationHigher timeframe remains bullish, with price breaking highs and closing above key levels, confirming bullish intent.
On the midterm, price swept internal liquidity and inducement, but that move was not enough to flip structure. Instead, it acted as a deeper engineering phase, taking out liquidity across a full range and mitigating a higher timeframe order block.
From there, I monitored midterm footprints and structure shifts. Price broke a significant midterm lower high, which aligned with sell-side liquidity being targeted.
Within this bullish expansion leg, price showed strong inefficiency — minimal meaningful pullbacks, signaling aggressive displacement.
As expected, price swept the full range, then flipped structure by breaking the higher high, confirming continued bullish structural intent.
This sequence suggests potential for another sell-side liquidity grab into an order flow / demand area before further upside expansion.
Until then, I’m simply tracking footprints and observing bullish behavior as liquidity is engineered and mitigated across key zones.
No forcing trades — just letting structure complete and waiting for confirmation.
Patience remains the edge.
Let’s see how price develops next.