Long
Long
Selena | XAUUSD · 2H – Bullish Channel Expansion Toward LiquiditPEPPERSTONE:XAUUSD FOREXCOM:XAUUSD
After forming a strong mid-range consolidation base, price impulsively broke above 5,300 and is now expanding within the bullish channel. The previous descending pressure has been invalidated, and structure favors continuation toward upper-channel liquidity near the 5,550–5,600 rejection zone. As long as price holds above the flip zone, bullish momentum remains dominant.
Key Scenarios
✅ Bullish Case 🚀
• Hold above 5,250
• Maintain higher-low structure
• 🎯 Target 1: 5,400
• 🎯 Target 2: 5,500
• 🎯 Target 3: 5,600
❌ Bearish Case 📉
• Break below 5,200
• 🎯 Target 1: 5,080
• 🎯 Target 2: 4,950
• 🎯 Target 3: 4,800
Current Levels to Watch
Resistance 🔴: 5,400
Major Resistance 🔴: 5,550 – 5,600
Support 🟢: 5,250 – 5,300
⚠️ Disclaimer: This analysis is for educational purposes only. Not financial advice. Long 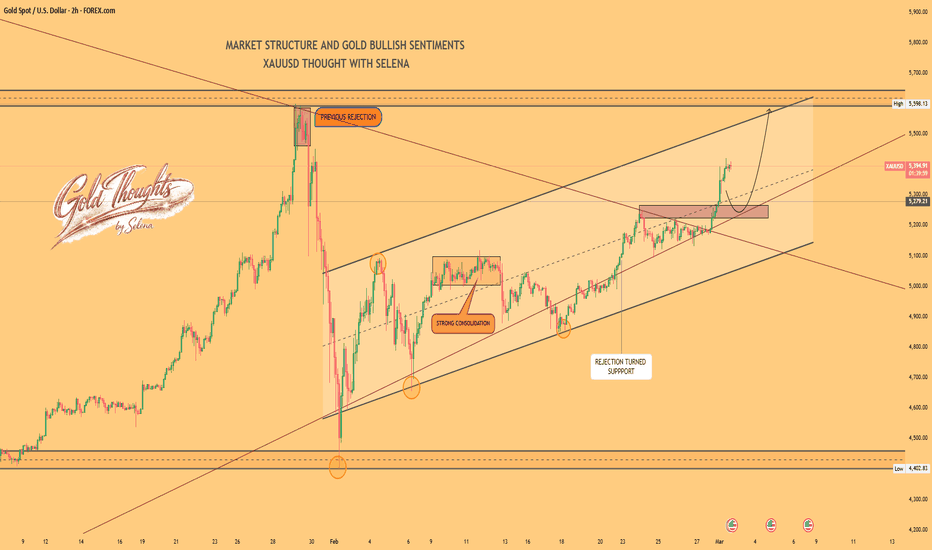
US 500 Index – Facing a Key Test of Trader SentimentThe US 500 index is facing a major sentiment test. Despite posting a strong rebound from yesterday’s initial 1.5% drop to 6760, to finish the day with a small 0.15% gain at 6875, the index is back down 0.75% again today, trading at 6825 at the time of writing (0630 GMT). The decision for US and Israeli forces to conduct coordinated attacks on selective targets across Iran that started on Saturday and are currently still on-going, operations that resulted in the death of Iran’s Supreme leader Ayatollah Ali Khamenei, have impacted the flow of oil and gas through the Strait of Hormuz, and retaliatory attacks by Iran on neighboring oil producers have helped to keep oil prices elevated stoking fears of higher inflation, a hit to global trade and corporate profits.
The index was already facing downside pressure after Nvidia’s strong Q4 results, released late on Wednesday 25th February failed to impress investors. The narrative for AI has seemingly evolved from a need to gain exposure to anything AI, to worries regarding when the colossal capital expenditure in the space may start to payoff in terms of increased revenue, to serious concerns about the destructive impact of Artificial Intelligence on the way that many companies currently generate their revenue.
Looking forward, the immediate focus may remain on the developing situation in the Middle East. While traders may have initially anticipated the conflict to be over quite quickly, overnight comments from President Trump have indicated it may take much longer, especially given the determination of the ruling regime to resist US and Israeli attacks by refusing to negotiate. How these events evolve across the remainder of this week could have a lasting impact on sentiment moving through the first quarter of 2026.
Technical Update: Choppy Sideways Activity Extends
US 500 price action has remained choppy and sideways throughout 2026, reflecting an ongoing balance between buyers and sellers. A decisive directional move may only emerge once one side gains control, allowing a clear closing breakout either to the upside or the downside.
As the chart above shows, the current sideways range is defined by 6760 on the downside, which is the 50% Fibonacci retracement, and 7004 to the upside, which matches the 38.2% Fibonacci extension. After Monday’s initial selling pressure following the latest geopolitical concerns, the support at 6760 held once again, triggering a price recovery. The successful closing defence of this level reinforces 6760 as a potential key support focus for the week ahead, while also ensuring that traders may need to keep focused on how sentiment responds to the on-going situation in the Middle East.
If Negative Themes Emerge:
If geopolitical concerns continue to build this week and further selling pressure is seen, closing breaks below 6760 may be needed to suggest scope for a phase of deeper price weakness. Such a move could suggest the market is unwinding part of the upside extremes seen during 2025.
If a more extended decline unfolds and prices close below the 6760 support level, the next level to monitor could then be 6700, which marks the deeper 62% retracement. A break below this area could raise the potential of further declines toward 6508, which is the November 21st low.
If Positive Themes Emerge:
While the support at 6760 continues to hold on a closing basis, it keeps open the possibility of renewed upside attempts, particularly if Middle East tensions were to ease. Should buying pressure rebuild, the key resistance to monitor appears to be 7004, which is the 38.2% Fibonacci extension level.
A closing break above 7004 may be needed to revive the prospect of renewed positive momentum and open the door to higher levels. As the chart above highlights, sustained closes above 7004 could see the focus shift toward 7053, which is the higher 61.8% extension level, and potentially beyond.
The material provided here has not been prepared accordance with legal requirements designed to promote the independence of investment research and as such is considered to be a marketing communication. Whilst it is not subject to any prohibition on dealing ahead of the dissemination of investment research, we will not seek to take any advantage before providing it to our clients.
Pepperstone doesn’t represent that the material provided here is accurate, current or complete, and therefore shouldn’t be relied upon as such. The information, whether from a third party or not, isn’t to be considered as a recommendation; or an offer to buy or sell; or the solicitation of an offer to buy or sell any security, financial product or instrument; or to participate in any particular trading strategy. It does not take into account readers’ financial situation or investment objectives. We advise any readers of this content to seek their own advice. Without the approval of Pepperstone, reproduction or redistribution of this information isn’t permitted.
 Short
Short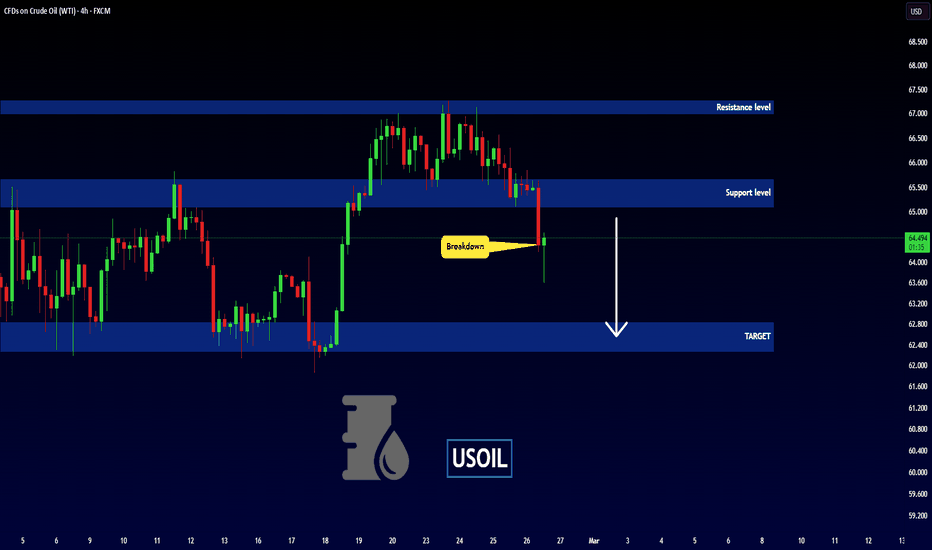
 Long
Long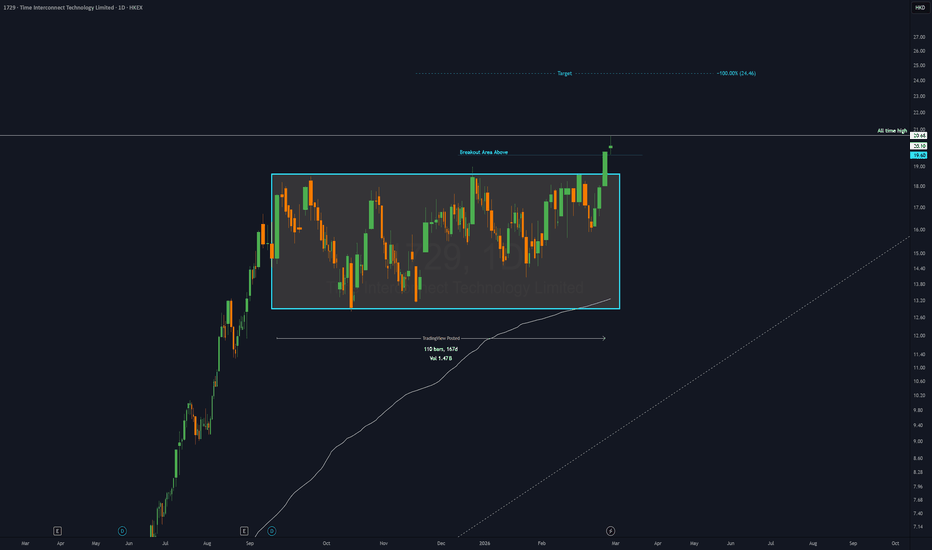
Underlying Support Remains: (2026 Outlook, Ep. 2: US Dollar)Underlying Support Remains, but Sell-Off Risk Is Rising (2026 Outlook, Ep. 2: US Dollar)
This series consists of 12 research notes covering 12 instruments. Each episode blends fundamental and technical analysis to frame a structured set of investment themes for 2026.
This is the Episode 2 which focuses on the US Dollar Index (DXY) and the key forces that could meaningfully influence USD performance throughout 2026.
________________________________________
1) Fed stance: the market may price in cuts early–mid year, but the Fed could move late → hawkish surprise risk
Because the Fed is arguably the world’s most important liquidity provider, any USD outlook should begin with the Fed’s policy function and reaction framework.
• Early to mid-year: incoming inflation and labor data may keep markets debating whether the Fed will cut sooner or later. This “pricing and repricing” process often leaves DXY range-bound, as expectations swing with each major data release.
• Late-year: if the Fed chooses to wait for clearer confirmation and delivers easing later than markets anticipated, the result can be a hawkish surprise, supporting the dollar via sentiment and rate expectations.
• Tail risk: investors should not dismiss the possibility that the Fed turns more hawkish than priced if inflation or price risks remain sticky. This aligns with the Fed’s long-standing emphasis on being data-dependent, adjusting policy as inflation and inflation expectations evolve.
Implication for DXY: the dollar may not rally immediately, but the USD floor could be reinforced by rate expectations that repeatedly reset hawkishly.
________________________________________
2) Tariffs: even if IEEPA is constrained, the tariff risk does not disappear—it simply shifts to a different legal channel. By signaling a viable route via Section 122, the administration keeps trade policy active and market-relevant.
Market and USD implications:
• This reinforces the message that a Trump-led administration is unlikely to retreat from its trade agenda.
• In narrative terms, tariffs can be viewed as a mechanism to r educe the trade deficit and potentially improve the current-account path, which can be USD-supportive , at least initially, through expectations and positioning.
• More broadly, the direction of policy also signals an intent to re-shore investment and shift domestic production incentives—another channel that can influence medium-term USD sentiment .
________________________________________
3) Japan FX intervention logic : if Japan buys JPY, it may need to sell USD assets → a USD headwind
The mechanism is straightforward:
• Supporting the yen via JPY buying can be associated with reducing USD-asset holdings at the margin, given Japan’s large external asset base.
• This is not a mechanical 1:1 relationship every time, but it is a closely watched risk channel because Japan holds a substantial amount of US Treasuries.
• As a result, FX intervention episodes can become a downside pressure point for the dollar.
________________________________________
4) Japan: top foreign holder of UST + BoJ hiking while the Fed eases → carry trade fades → unwind risk rises
The key is flow, not headlines.
• Japan is the largest foreign holder of US Treasuries, making its portfolio actions highly relevant to global rates and FX flows.
• The BoJ is hiking while the Fed is cutting, the rate differential narrows.
• As spreads compress, the incentive for JPY carry trades declines, increasing the probability of an unwind—more buy JPY / sell USD behavior, or at least reduced intensity of buy USD / sell JPY flows.
• This dynamic can weigh on USD through a gradual but meaningful positioning adjustment.
________________________________________
5) Relative growth and competitiveness with Eurozone : if Europe remains less competitive, EUR weakens → DXY gains structural support
Because DXY has a large EUR weight, the euro’s trajectory matters materially.
Europe’s structural constraints—growth challenges, competitiveness issues, demographic headwinds, and public-debt burdens—can keep EUR under pressure over the long run. Even if US economiy is not “excellent” in absolute terms, it can still look relatively stronger, helping DXY hold up structurally.
(We will explore Europe’s structural challenges in more detail in the next episode of this series.)
________________________________________
6) War / geopolitics: risk-off boosts safe-haven demand → USD benefits as the global liquidity currency
During wars or sharp geopolitical escalations, markets typically shift toward capital preservation and liquidity.
• The USD often benefits from its role as the world’s central funding and settlement currency, especially during sudden panic phases when investors prioritize immediate liquidity.
• A large-scale war can also introduce two additional USD-supportive channels:
War funding
A major conflict requires large-scale funding. Historically, governments have financed wars through issuance—famously including “War Bonds” during World War II. In a modern context, if the US needs to mobilize capital, policymakers may need to maintain attractive yields or a tighter policy stance to support funding demand—potentially USD-supportive.
War inflation
Wars often trigger energy and commodity shocks, feeding inflation pressures. If inflation risks rise meaningfully, the Fed may need to remain more hawkish than the market expects, supporting USD via yields and policy expectations.
________________________________________
7) If geopolitics persists but does not escalate into a large war: USD’s support may be episodic, while precious metals may benefit
If geopolitical risks stay elevated but don’t escalate into a major war, USD support is likely to be episodic rather than trending—with hedging demand tilting more toward precious metals, which can cap USD upside or mildly pressure the dollar, depending on yields and positioning.
________________________________________
8) Debt risks and Ray Dalio’s sequence: in a credit crunch, USD often strengthens first
US debt dynamics cannot be ignored. If the world faces a credit crunch from any source, FX moves can become nonlinear and complex. Ray Dalio’s framework helps illustrate the sequence:
• In a credit crunch / deleveraging, markets urgently demand cash and liquidity, forcing asset sales.
• Because USD sits at the center of global funding markets, demand for USD tends to surge—so USD often strengthens in the first phase of stress.
• If the policy response later shifts toward heavy liquidity injections or monetization, then currency debasement concerns can become more prominent in the next phase—consistent with Dalio’s “debt-cycle” playbook.
________________________________________
9) US yields are “hard to fall” → a stabilizer for USD even without an immediate USD rally
Consistent with the prior episode’s rate framework: if Treasury yields prove resistant to falling, USD may not surge, but it often becomes difficult for USD to weaken aggressively.
• The dollar may not “rip higher” immediately.
• But the yield advantage, together with carry/relative-return dynamics, can provide a durable support layer.
________________________________________
Technical View: Neutral ( with an upward bias )
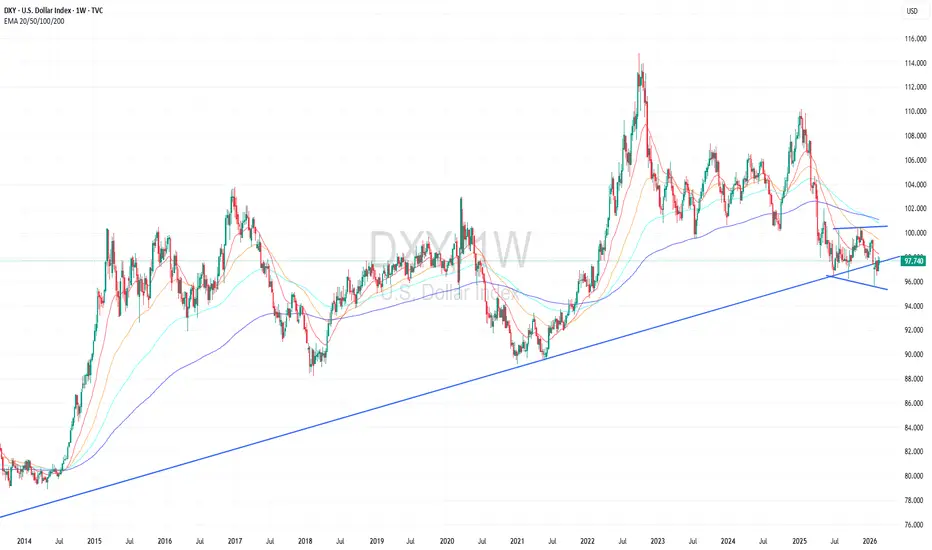
Technically, DXY has broken below an ascending trendline and is now consolidating around the breakout area, which suggests the break is not yet fully decisive. Meanwhile, the EMA structure is beginning to stack bearish, signaling a rising probability of a broader trend shift.
• A clean break below the sideways channel, especially under 96.00, would be a bearish continuation signal and could confirm a larger-scale bearish reversal.
• However, DXY may also remain range-bound within roughly 96.00–101.00, waiting for a decisive breakout. For now, the broader bias remains neutral-to-up, unless clearer downside confirmation appears.
________________________________________
Summary and Outlook
Key pillars that can keep DXY supported in 2026 include:
• A Fed stance that may repeatedly reset market pricing in a hawkish direction
• Treasury yields that are difficult to decline, reinforcing USD support through relative return
• A risk environment where risk-off episodes continue to deliver sporadic safe-haven demand
• Ongoing relative weakness in other regions, particularly Europe, sustaining a relative-value tailwind for USD
Watch US Treasury yields—especially the 10-year, a key gauge of bond-market health. A sustained break above 5% could signal rising stress and trigger a sharper move higher.
Given the mix of supportive and offsetting drivers, the USD outlook is adjusted from long-term bullish to Neutral with an upward bias, until the market delivers clearer evidence of a structural shift.
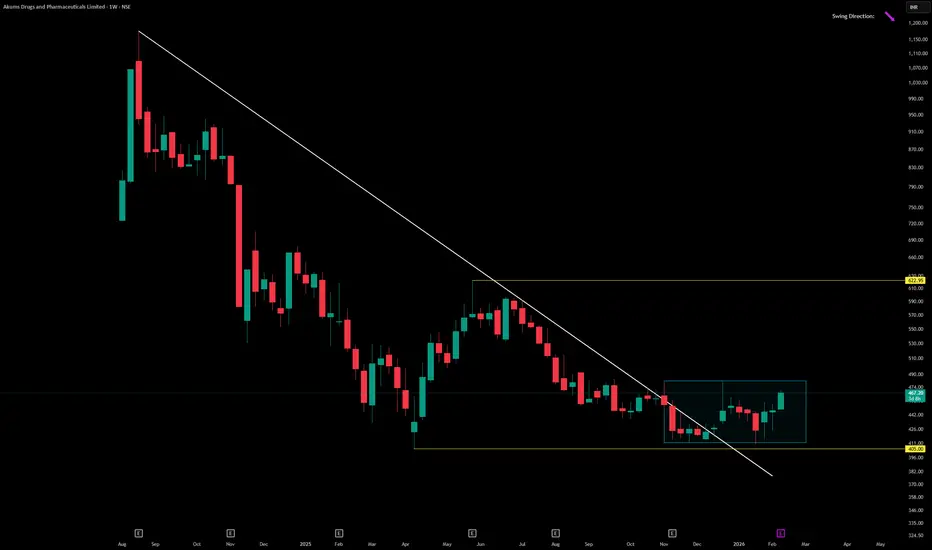
AKUMSAkums Drugs & Pharmaceuticals Ltd is a mid‑cap pharmaceutical contract development and manufacturing organization (CDMO), incorporated in 2004 and headquartered in New Delhi. It is India’s largest CDMO, catering to formulations across pharmaceuticals, nutraceuticals, cosmetics, and dermatology.
Promoter: The founding team continues to lead Akums, positioning it as a trusted partner for both domestic and multinational pharma companies.
FY22–FY25 Snapshot
Sales – ₹3,420 Cr → ₹3,780 Cr → ₹4,210 Cr → ₹4,560 Cr
Net Profit – ₹265 Cr → ₹310 Cr → ₹355 Cr → ₹402 Cr
Operating Performance – Moderate → Strong → Very Strong → Excellent
Dividend Yield – 0.0% (company reinvests earnings into growth)
Equity Capital – ₹146 Cr (post‑IPO listing in FY25)
Total Debt – ₹1,020 Cr → ₹940 Cr → ₹810 Cr → ₹720 Cr (steady deleveraging)
Fixed Assets – ₹1,850 Cr → ₹1,910 Cr → ₹1,980 Cr → ₹2,050 Cr
EPS (TTM) – ₹8.9 → ₹9.7 → ₹10.2 → ₹11.0
Institutional Interest & Ownership Trends
Promoter holding: ~55%, reflecting strong family control.
FIIs/DIIs: Rising interest post‑IPO, with DIIs adding exposure to India’s CDMO growth story.
Public float: ~45%, with delivery volumes showing accumulation by long‑term investors.
Strategic Moves & Innovations
Expansion in pharma formulations across tablets, injectables, and biologics.
Diversification into nutraceuticals, cosmetics, and dermatology.
Focus on global certifications (EU‑GMP, WHO) to expand exports.
Investment in R&D and regulatory compliance to strengthen CDMO positioning.
Cash Flow & Balance Sheet Strength
Operating cash flows strengthened in FY25, supported by higher utilization of manufacturing facilities.
Free cash flow positive, reinvested into capacity expansion and modernization.
Debt reduced steadily, improving balance sheet resilience.
Strong asset base with multiple manufacturing plants across India.
Risk Factors
Dependence on regulatory approvals and compliance standards.
Margin sensitivity to raw material costs and pricing pressure from clients.
Competition from global CDMOs and Indian peers.
Currency risks due to export exposure.
Investor Takeaway
Akums Drugs & Pharmaceuticals Ltd. demonstrates steady revenue growth, margin expansion, and deleveraging, supported by its leadership in India’s CDMO space and diversification into nutraceuticals and cosmetics. With strong institutional interest post‑IPO and global certifications, it is well‑positioned for sustained growth, though investors should monitor regulatory and competitive risks.  Long
Long
 Long
Long
 Long
Long
 Long
Long
 Long
Long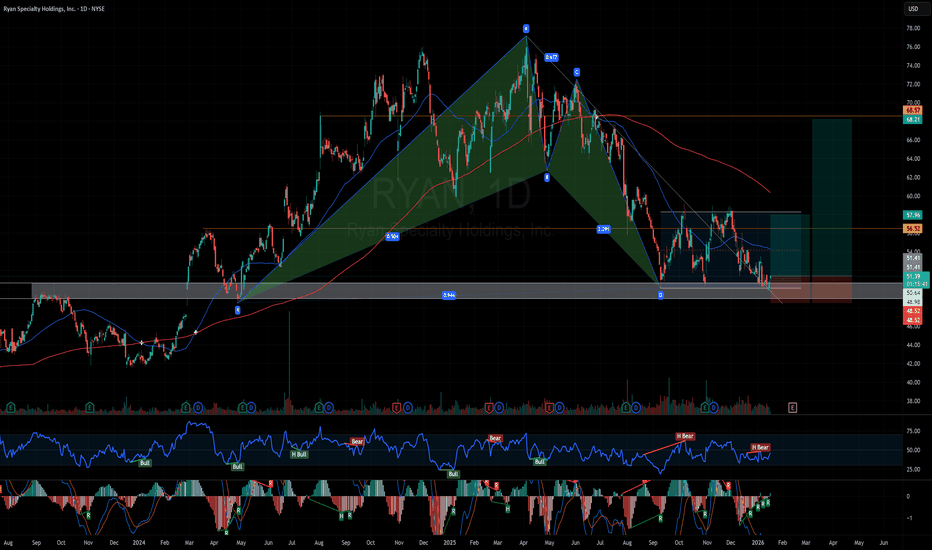
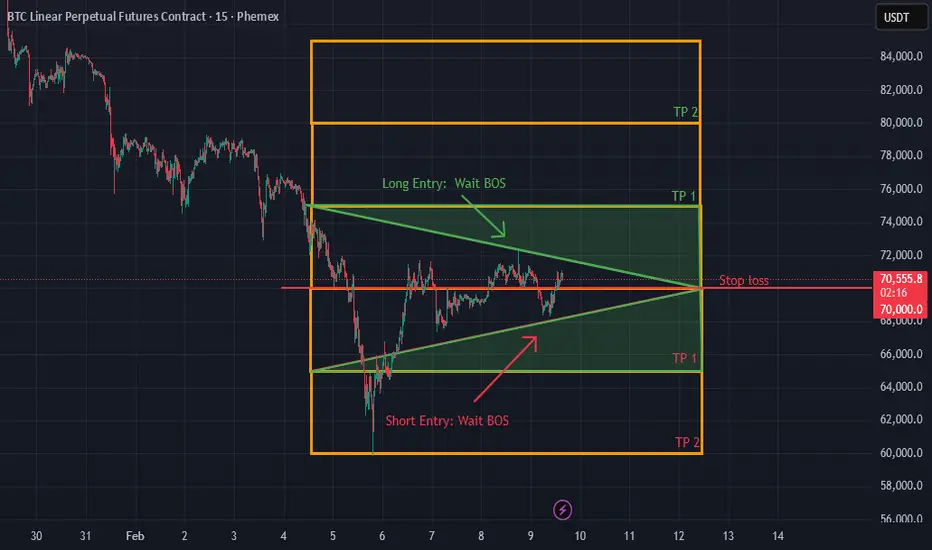
A+ Setup Consolidation Breakout StrategyConsolidation Breakout Strategy (Summary)
In this strategy, the first step is to identify a clear consolidation zone and mark it with a box to define the trading range visually. Once price is ranging, we wait patiently for a valid breakout or breakdown with a strong candle close outside the range.
If you want additional confirmation before entering a trade, it’s important to recognize candlestick patterns. Understanding patterns such as Doji, Bullish/Bearish Engulfing, Hammer, Shooting Star, Morning Star, Evening Star, and others will significantly increase the accuracy of your execution.
After the breakout, we do not enter immediately. Instead, we wait for a retest of the breakout level. The retest candle becomes our Point of Interest (POI) and serves as the execution entry, ensuring the trade aligns with both price action and candlestick confirmation.
Stop-Loss Options
Two stop-loss methods can be used:
1. Aggressive Stop Loss
• Placed below the low of the retest candle (for buys) or above the high (for sells).
• Provides better risk-to-reward, but has a higher chance of being stopped out, especially on lower timeframes.
2. Conservative Stop Loss
• Placed on the opposite side of the consolidation zone.
• Offers more protection against fake breakouts and is more suitable for consistent and prop-firm style trading.
Take-Profit Methods
Primary TP — Price Projection (Measured Move)
• Measure the full height of the consolidation range.
• Project the same distance from the breakout point in the direction of the move.
• This projected level is used as the main target, as shown on the chart.
This method is especially useful when price is trading in new territory or near all-time highs, where no clear resistance is present.
Trailing Stop for Trend Continuation
Since price does not move in a straight line and often forms new micro-ranges during trends, a trailing stop approach is used to capture extended moves:
• After price creates a new consolidation, move the stop loss below the most recent range low (for buys) or above the range high (for sells).
• Continue trailing the stop behind each new structure until stopped out.
This is a trend-following management method designed to maximize reward-to-risk and allow winners to run.
Alternative Trailing Methods
Traders may also trail stops using indicators such as:
• 21 SMA, or
• SuperTrend
In this case, the stop loss is trailed below (for buys) or above (for sells) the indicator as long as trend conditions remain valid.
Future Use of the Range Zone
The original consolidation zone is extended to the right because it often acts as a future support or resistance area. As shown on the chart, price later returned to the range, respected it as support, and continued higher — confirming the importance of these zones.
Performance Expectation
When all rules are followed correctly — proper consolidation, confirmed breakout, retest entry, and disciplined risk management — the realistic win rate for this setup is approximately 50% to 65%, with positive expectancy due to favorable risk-to-reward ratios.
⸻
This Consolidation Breakout Strategy is just one of my A+ setups. There are many more high-probability strategies I use and will be sharing soon.
Cabeero Education 
 Long
Long