GOLD 4H: The Final Dip Before $4,870 Multi-Month Surge?Technical Analysis
Macro Market Structure: Gold (XAUUSD) maintains a clean bullish market structure on the 4-hour timeframe. The primary Descending Trendline that capped upside expansion through the summer months has been decisively broken.
Trendline Retest & Demand Zone: Following a peak near $4,543, price executed a controlled corrective pull-back into a descending wedge/flag structure. Price has now retested the multi-month trendline breakout confluence near the $4,179 Support Area, establishing a strong demand zone where buyers are aggressively absorbing sell pressure.
Key Technical Levels:
Major Target / Daily Resistance: $4,869.052
Intermediary Resistance: $4,543.289
Retest Support Zone: $4,179.052
Macro Invalidation / Lower Demand: $3,978.988
Execution Strategy: As long as price holds above the $4,179 retest structure, the technical pathway favors a bullish continuation. A clean break back above $4,543 confirms the next macro expansion phase, targeting the $4,869 daily resistance level.
Fundamental Analysis
Central Bank Accumulation: Structural central bank reserve diversification provides an enduring physical floor under gold, limiting deep downside corrections despite temporary macroeconomic headwinds.
Geopolitical & Fiscal Hedge: Escalating geopolitical tensions in West Asia and ongoing global debt sustainability concerns continue to fuel persistent institutional safe-haven demand.
Macro Volatility: While short-term monetary policy rhetoric creates tactical pullbacks, long-term real yield dynamics and dollar hedging favor prolonged upside expansion for physical bullion.
Disclaimer: Educational content only. Trading spot gold (XAUUSD) involves high market risk and leverage volatility. Always execute based on your personal risk parameters and trading plan.  Long
Long
XAUUSD — Bullish Wave 3 From Buy ZoneXAUUSD — Bullish Wave 3 From Buy Zone
Gold is building a bullish recovery structure after completing the previous bearish wave near the lower area. From Kelly’s view, the current chart suggests that XAUUSD may be preparing for a new upside continuation while price is holding around the Buy zone wave 3.
The key idea is simple: gold may be forming wave (2) correction now, and if buyers defend the current buy zone, wave (3) can start pushing toward the upper liquidity levels.
⟡ Market Structure
Gold reacted strongly from the previous low near 4,280–4,300, showing that sellers lost momentum and buyers started to rebuild structure.
Price is now trading around 4,411, right above the Buy zone wave 3 near 4,390–4,410. This zone is important because it may act as the base for the next bullish impulse.
If this support holds, gold may continue higher toward 4,441, 4,476, and the strong liquidity zone near 4,510. A clean break above 4,510 would strengthen the bullish continuation toward the Resistance Fibonacci + FVG / Sell zone wave 4 around 4,585–4,605.
➤ Key Levels
◌ Current price area: 4,411
◌ Buy zone wave 3: 4,390–4,410
◌ First liquidity: 4,441
◌ Second liquidity: 4,476
◌ Strong liquidity: 4,510
◌ Resistance Fibonacci + FVG: 4,585–4,605
◌ Final wave 5 target: 4,725–4,740
◌ Bullish invalidation: below 4,360
⌁ Elliott Wave View
The chart shows a possible bullish Elliott Wave recovery.
Wave (1) formed after gold bounced from the lower demand area.
Wave (2) is now correcting back into the 4,390–4,410 buy zone.
If this zone holds, wave (3) may push price toward 4,510 and then 4,585–4,605.
After that, wave (4) may create a short pullback.
The final wave (5) target remains near 4,725–4,740.
This is why Kelly is not chasing buys too late. The cleaner plan is to wait for confirmation around the buy zone, then follow the bullish structure step by step.
▸ Trading Scenario
Preferred bullish scenario
Entry: Buy around 4,390–4,410 if price gives bullish confirmation from the Buy zone wave 3
Stop Loss: Below 4,360
Take Profit 1: 4,441
Take Profit 2: 4,476–4,510
Take Profit 3: 4,585–4,605
Take Profit 4: 4,725–4,740
Alternative entry
If gold breaks above 4,510 and retests this level as support, buyers may look for continuation toward 4,585–4,605.
◌ Invalidation
The bullish view becomes weaker if gold breaks below 4,360 and fails to reclaim the buy zone. In that case, wave (2) may extend lower and the bullish setup needs more confirmation.
⌁ Kelly’s View
Kelly’s main view remains bullish while gold holds above 4,390–4,410. The market is showing a recovery structure, and the current pullback may be only a correction before wave (3) continues higher.
If buyers defend the buy zone, gold may continue toward 4,441, 4,510, then the larger upside zone around 4,585–4,605. The bigger Elliott target remains near 4,725–4,740.
Do you think gold will start wave (3) from this buy zone, or retest lower before the next rally? Long 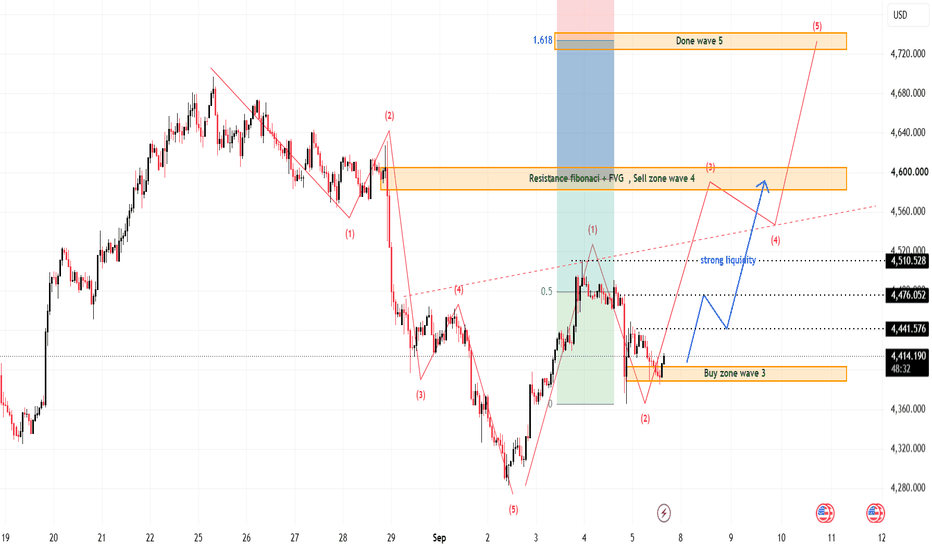
BITCOIN - Consolidation following the NFP. There's a chance...BINANCE:BTCUSDT.P is consolidating within the 76,000–81,000 range. The key target at 83K has still not been reached, which is why it remains relevant. Yesterday’s NFP data triggered another round of liquidity collection, and the market continues to consolidate
Bitcoin continues to consolidate. Yesterday’s attempt to break through resistance failed amid the mixed NFP report. However, the market is holding the downside, with price consolidating above 79,500.
Technically, the medium-term outlook remains favorable. The flagship asset previously broke out of the global bearish trend. ETF inflows continue to increase, as does bullish sentiment. Within the current consolidation, I would highlight two key levels: 79,850 and 77,000
Resistance levels: 79850, 81300, 82850
Support levels: 79550, 77000
At the moment, price is consolidating above the intermediate 79,550 support zone, while a close above 79,850 could trigger a continuation of the local uptrend.
However, given yesterday’s news, the broader consolidation could continue, and the market maker may form a retest of the lower area of interest. The key focus is 77,000 — the second trigger. A long squeeze could also trigger an impulse toward 83K
Best regards,
R. Linda!  Long
Long
How will gold react after the news?Based on the XAU/USD chart, the current structure shows that price is correcting within a larger uptrend. The most notable point is that price is currently trading between support at 4,320 and resistance at 4,527–4,580, while a descending trendline needs to be broken to confirm a return of bullish momentum.
🔴 Resistance
1. 4,520 – 4,535 — Key Resistance
This is the Resistance Zone on the chart.
Reference level: 4,527.605.
This is also the breakout area that price needs to overcome to confirm a breakout from the current corrective structure.
If price tests this zone but gets rejected → the possibility of continued sideways movement/correction remains.
2. 4,570 – 4,585 — Strong Resistance
Key level around 4,580.038.
This is the next target after a breakout above 4,527.
If price breaks above this entire zone, the bullish structure will become very positive.
🟢 Support
1. 4,315 – 4,330 — Main Support
This is an important Support Zone, with the key level at 4,320.056.
Price has reacted several times around this area.
More importantly, the long-term ascending trendline is also converging around this support zone.
If the 4,315–4,330 zone continues to hold → this remains the preferred area to look for BUY signals.
📉 Descending Trendline
The trendline from the most recent high is currently putting pressure on price.
The structure can currently be viewed as:
Bottom → strong rally → formation of a high → correction → consolidation below the descending trendline.
Therefore, a trendline breakout + break above 4,527 will be more significant than simply a spike above the resistance zone.
📈 Bullish Scenario
The ideal scenario:
4,320 → consolidation → break the descending trendline → break 4,527 → 4,580
After breaking above 4,527, it would be better to wait for price to retest 4,520–4,535 and hold this zone. This would provide a more reliable confirmation of continued bullish momentum.
Targets:
TP1: 4,527
TP2: 4,580
Break above 4,580 → further upside targets can be extended.
📉 Bearish Scenario
If price continues to be rejected below the trendline and fails to break 4,520–4,535, it could move back toward:
4,450 → 4,400 → 4,320
In particular, if 4,320 is strongly broken, the current bullish scenario will weaken significantly, and the larger market structure will need to be reassessed. Long 
GOLD - Correction and retest of the 4460 resistance levelICMARKETS:XAUUSD continues its rebound after the false breakdown of the 4,300 support level. The fundamental backdrop remains mixed, but selling pressure is still present
The dollar is stagnating, potentially due to intervention from the Bank of Japan. The correction in the Dollar Index is giving gold room to recover. The key event is Friday’s NFP report. A weak report could support a further recovery in gold, while a strong report could bring selling pressure back. The 4,460 level remains the nearest resistance, with 4,300 acting as support.
Drivers:
Upside: weak NFP data on Friday, further dollar weakness, lower yields, technical rebound.
Downside: strong NFP data, hawkish Fed rhetoric, stronger dollar, renewed rise in oil prices
Resistance levels: 4,466, 4,480
Support levels: 4,300
The long squeeze of the 4,300 support zone has triggered a rebound, which has developed into a stronger move amid the dollar correction.
Ahead lies the 4,466–4,480 resistance zone. A short squeeze in this area could trigger a downside pullback, potentially pushing gold back into the range ahead of the NFP release.
The retest of this resistance zone and the market’s reaction to it will help determine the medium-term direction
Best regards,
R. Linda. Short 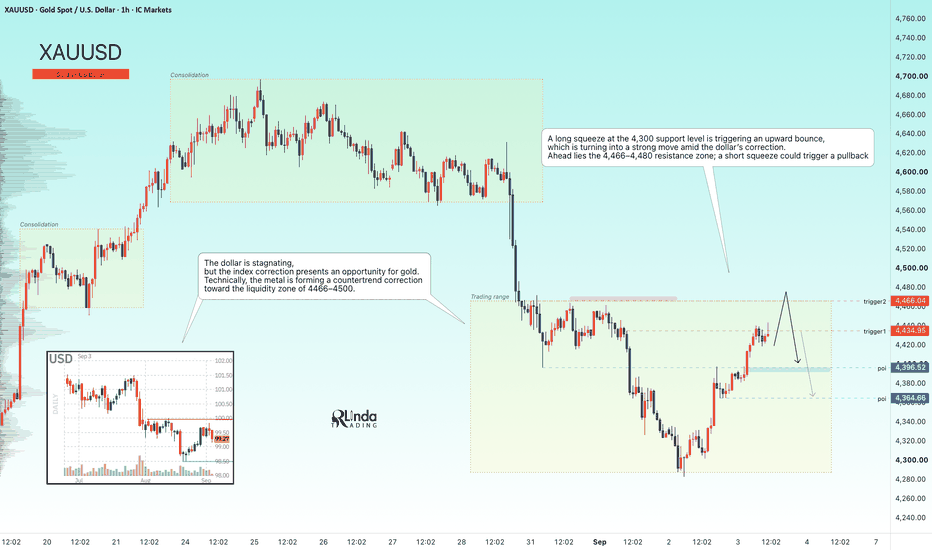
Long 
ETHUSDT - Consolidation ahead of a potential breakout and rallyBINANCE:ETHUSDT.P continues to consolidate after the strong rally, but at the moment, the market is once again testing resistance within yesterday’s rally...
Bitcoin is consolidating near the 83K resistance, which represents a technical retracement zone from the previous bearish cycle. A close above 83K could trigger a bullish impulse, providing additional support for the altcoin market.
From a broader perspective, Ethereum has not declined after the strong rally. A three-week consolidation is forming. At the same time, the retest of the 2,356 support ended with a bounce and a local rally, after which the market moved back into consolidation near resistance. This increases the probability of an upside breakout.
Today, all attention is focused on NFP. Weak data could strengthen the bullish trend, while hawkish signals could trigger a correction, in which case the market may continue consolidating.
Resistance levels: 2,550, 2,620, 2,790
Support levels: 2,450, 2,356
There are several possible scenarios. As part of a local pre-breakout consolidation, Ethereum could test 4,500 before moving higher. However, gradual compression toward resistance could trigger an upside breakout. A close above the level could become the technical catalyst for a move toward 2,620–2,790
Best regards,
R. Linda!  Long
Long
BITCOIN - Consolidation Following Strong GrowthBINANCE:BTCUSDT.P , after a strong rally, has entered a consolidation phase near the resistance formed by the technical retracement of the previous bear cycle. What happens next?
Bitcoin previously broke the structure of its bearish trend, but it has still not tested the 83,000 technical retracement zone, which also represents a liquidity pool. Therefore, we can assume that this target remains relevant within the current local bullish trend.
After the strong rally, price has been consolidating for two weeks without forming a significant pullback. This can also be viewed as a bullish indication and a potential setup for further upside.
Technically, the market remains in consolidation. Price is showing a relatively weak reaction to the conflict escalation and has not declined despite the strong rally. A long squeeze of the 76,800–76,300 zone could develop before the move higher toward the 83K target.
The market remains bullish
Resistance levels: 79,500, 81,200, 83,000
Support levels: 76,800, 76,400, 75,600
A false breakdown of support as part of a liquidity-hunting phase, followed by consolidation above the 76,400–76,853 zone, could become a technical catalyst for further upside
Best regards,
R. Linda. Long 
 Long
Long
XAUUSD — Bullish Setup From 4,425
Gold is building a bullish recovery structure after completing the previous bearish wave 5 near the lower demand zone. From Kelly’s view, the current chart suggests that XAUUSD may be preparing for another upside leg if buyers continue to defend the End wave C / Buy zone.
The key idea is simple: gold may correct slightly first, but as long as price holds above the buy zone, the bullish structure remains valid toward the upper liquidity area.
⟡ Market Structure
Gold reacted strongly from the 4,280–4,300 area, where the previous downside wave appears to have completed. After that, price created a new bullish impulse and is now consolidating around 4,472–4,488.
The most important support is the 4,420–4,430 Buy zone. This zone is marked as the potential end of wave C. If price pulls back into this area and buyers defend it, gold may start a new bullish wave.
The first confirmation area is around 4,488–4,500. A clean break above this zone would support stronger upside continuation toward 4,525–4,550, then the major liquidity target near 4,615–4,630.
➤ Key Levels
◌ Current price area: 4,472–4,488
◌ End wave C / Buy zone: 4,420–4,430
◌ Bullish confirmation: above 4,500
◌ First upside target: 4,525–4,550
◌ Main liquidity target: 4,615–4,630
◌ Bullish invalidation: below 4,400
⌁ Elliott Wave View
The chart shows that the previous bearish wave 5 may have already completed around 4,280–4,300.
From that low, gold is now forming a new recovery structure. The current pullback may be part of an ABC correction before the next bullish wave develops.
If wave C ends around 4,420–4,430, buyers may push price higher again. The next upside sequence can target 4,500, then 4,550, and finally the liquidity zone around 4,615–4,630.
This is why Kelly is not chasing buys at the current price. The cleaner plan is to wait for price to confirm support or break above the short-term liquidity level.
▸ Trading Scenario
Preferred bullish scenario
Entry: Buy around 4,420–4,430 if price gives bullish confirmation from the End wave C / Buy zone
Stop Loss: Below 4,400
Take Profit 1: 4,500
Take Profit 2: 4,525–4,550
Take Profit 3: 4,615–4,630
Alternative entry
If gold breaks and holds above 4,500, buyers may look for continuation toward 4,525–4,550 without waiting for a deeper pullback.
◌ Invalidation
The bullish view becomes weaker if gold breaks below 4,400 and fails to reclaim the buy zone. In that case, the recovery structure may need more correction before a new bullish setup appears.
⌁ Kelly’s View
Kelly’s main view is bullish while gold holds above 4,420–4,430. The market has already reacted strongly from the lower demand area, and the current movement looks more like a correction before continuation.
If buyers defend the buy zone and price breaks above 4,500, gold may continue toward 4,550 and the main liquidity zone near 4,615–4,630.
Do you think gold will retest the buy zone first, or break above 4,500 directly? Long 
Long 
Waiting for today’s ADP report.Based on the XAU/USD chart, the current structure has clearly shifted into a short-term bearish correction. Price has just moved away from the resistance zone and is heading toward the support area below.
🔴 Resistance: 4,360 – 4,380
This is currently the most important zone, with the marked level at 4,378.195.
This was previously a Resistance Zone.
After the downside breakout, this area could shift from support to resistance.
Price is currently trading below this zone, so if it rebounds to 4,360–4,380 and forms a rejection candle → SELL pressure could return.
For the short-term bearish structure to weaken, price needs to reclaim this zone and close clearly above it.
🟢 Support: 4,220 – 4,240
This is the main Support Zone on the chart, with the reference level around 4,230.287.
This zone is located just above the longer-term bullish trendline.
This area previously generated a bullish reaction.
If price continues declining toward 4,220–4,240, we should observe the price reaction to assess the possibility of a BUY.
If this zone holds, price could form a rebound back toward 4,360–4,380.
📉 Key Point: Moving Averages
The two MAs on the chart are also giving cautious signals:
The fast green EMA has turned downward.
Price is currently trading below both EMAs.
The fast EMA is below / moving downward toward the slower MA → short-term momentum is leaning toward SELL.
However, price is still approaching the bullish trendline, so we cannot yet consider this a complete bearish trend on the larger structure.
📌 TRADING PLAN
SELL GOLD: 4377–4379
Stop Loss: 4389
Take Profit: 200–500–1000 pips
BUY GOLD: 4230–4228
Stop Loss: 4220
Take Profit: 200–500–1000 pips Short 
Gold is gradually regaining its position ahead of the NFP reportThe current structure of XAU/USD is showing a bullish recovery from the lows, but price is still trading below a key resistance zone. The chart structure is currently favoring a potential retest of support followed by another move higher.
🔴 Resistance
4,445 – 4,465 — Major Resistance
This is the marked Resistance Zone, with the key level at 4,465.346.
Above this area, there is also a descending trendline connecting previous highs, creating additional selling pressure.
Therefore, the 4,445–4,465 area is a zone that requires special attention.
If price breaks out and closes clearly above 4,465, the structure will turn more positive and open the possibility for further upside.
🟢 Support
1. 4,400 – 4,415 — Near Support
This is the first Support Zone.
The reference level is 4,412.749.
Price is currently reacting around this area.
If this zone holds, price could continue forming higher highs and move toward 4,445–4,465.
2. 4,380 – 4,390 — Key Support
The key level is around 4,386.451.
This is a deeper support zone and is also converging with the ascending trendline.
If price corrects down to this area while the trendline continues to hold, this would be a relatively attractive zone to watch for a BUY signal.
📈 Bullish Scenario
The scenario I consider the most positive:
4,400–4,415 → minor correction → support holds → BUY → 4,445 → 4,465
If 4,465 breaks out, the next target will be extended according to the new bullish structure.
📉 Correction Scenario
If price is rejected at 4,445–4,465, there is a high probability of a pullback toward:
4,445 → 4,412 → 4,386
In particular, if 4,386 is strongly broken, caution is required because the ascending trendline could also be broken.
📌 TRADING PLAN
BUY GOLD: 4386–4384
Stop Loss: 4374
Take Profit: 200–500–1000 pips
SELL GOLD: 4465–4467
Stop Loss: 4477
Take Profit: 200–500–1000 pips Long 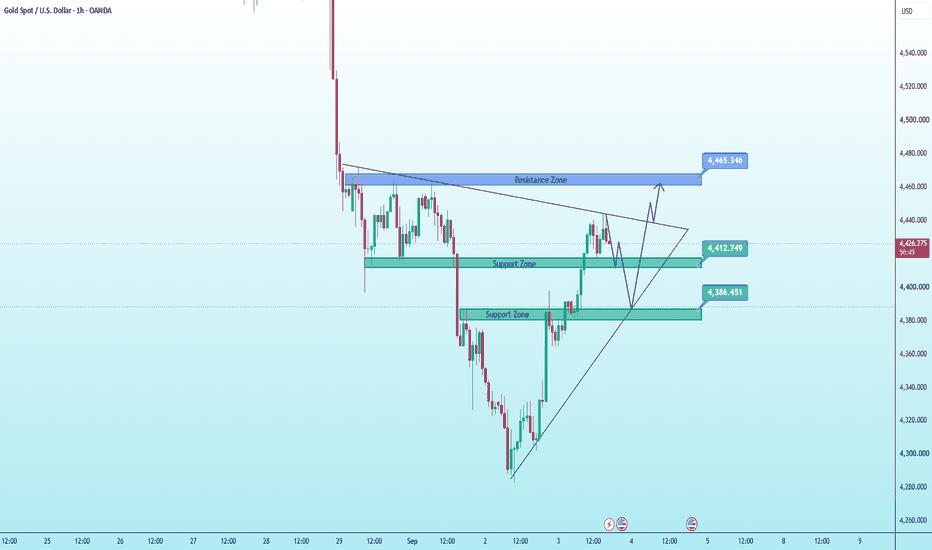
 Long
Long
XAUUSD 15M | SMC + Price Action Setup📊 Market Structure
Gold has shifted from the previous bearish structure into a short-term bullish sequence after forming a CHoCH and subsequently printing a BOS. 📈
Price is currently trading inside an ascending channel and approaching the 4,385–4,395 support/retest area after testing the recent highs around 4,430–4,440.
🟢 Bullish Scenario
The key area to watch is the 4,385–4,395 support zone. 🔎
If price retraces into this area and shows bullish price action — such as a rejection, displacement or a lower-timeframe structure shift — continuation toward the recent highs becomes possible.
🎯 Potential upside areas:
4,430–4,440 — recent high
4,450+ — next expansion area
🔴 Bearish Scenario
If the 4,385–4,395 support fails with strong bearish displacement and price establishes acceptance below the zone, the bullish structure could weaken. ⚠️
The next important area is the 15M FVG + OB around 4,300–4,320.
🔻 Potential downside path:
4,385 → 4,350 → 4,320–4,300
🧠 SMC Confluence
🔹 CHoCH — early structural shift
🔹 BOS — confirmation of short-term bullish structure
🔹 15M FVG + OB — potential retracement/demand area
🔹 1H OB around 4,280–4,300 — higher-timeframe support
🔹 4,385–4,395 — immediate structure/retest zone
🔹 4,430–4,440 — current liquidity/high area
⚖️ Bias
Short-term bullish while 4,385–4,395 holds.
However, I would wait for confirmation at the support rather than assuming the level will hold.
📌 Invalidation: A decisive break and acceptance below the relevant support structure would weaken this bullish scenario.
💡 This analysis represents a technical market scenario, not a guaranteed outcome or financial advice. Price can move in either direction, so risk management is essential. Long 
XAUUSD — Elliott Wave Recovery From 4,286
Gold is showing a strong Elliott Wave recovery after completing the previous bearish wave 5 near the 4,286–4,300 demand area. From Kelly’s view, the current chart suggests that XAUUSD has shifted into a short-term bullish correction structure, but price is now approaching an important Fibonacci sell zone where a pullback may appear first.
The key idea is simple: gold may push higher to complete the current upside wave, then correct into the buy zone before continuing toward the next higher Fibonacci target.
⟡ Market Structure
Gold reacted strongly from the done wave 5 area near 4,286–4,300, showing that buyers defended the lower liquidity zone. After that reaction, price built a bullish impulse and is now trading around 4,437.
The current upside structure looks like a developing 5-wave recovery. Price may still have room to test the 4,475–4,490 area, marked as the Done wave 5 / Sell zone Fibonacci. This zone is important because buyers may take profit there, and a short ABC correction can appear.
If price rejects from this Fibonacci zone, the next clean support to watch is the End wave C / Buy zone around 4,385–4,395. If this zone holds, gold may start another bullish leg toward the upper target near 4,520–4,530.
➤ Key Levels
◌ Current price area: 4,437
◌ Done wave 5 / Sell zone Fibonacci: 4,475–4,490
◌ Upper Fibonacci target: 4,520–4,530
◌ End wave C / Buy zone: 4,385–4,395
◌ Strong lower support: 4,286–4,300
◌ Bullish invalidation: below 4,365
⌁ Elliott Wave View
The chart suggests that the previous bearish wave 5 may have already completed around 4,286–4,300.
From that low, gold appears to be building a new bullish recovery:
Wave (1) started from the lower demand zone.
Wave (2) corrected back but held above the recent low.
Wave (3) pushed price higher with stronger momentum.
Wave (4) may create a short pullback.
Wave (5) could finish near 4,475–4,490.
After wave (5) completes, gold may form an ABC correction into 4,385–4,395 before buyers try to continue toward 4,520–4,530.
▸ Trading Scenario
Preferred bullish scenario
Entry: Buy around 4,385–4,395 if price gives bullish confirmation from the End wave C / Buy zone
Stop Loss: Below 4,365
Take Profit 1: 4,475–4,490
Take Profit 2: 4,520–4,530
Alternative scenario
If gold breaks above 4,490 and holds above this zone, the bullish structure may continue directly toward 4,520–4,530 without a deep correction.
◌ Invalidation
The bullish recovery becomes weaker if gold breaks below 4,365 and fails to reclaim the buy zone. In that case, the ABC correction may extend lower, and the bullish continuation setup needs to be delayed.
⌁ Kelly’s View
Kelly’s main view is bullish after the strong reaction from 4,286–4,300, but buying directly into the Fibonacci sell zone is not the cleanest plan.
The better setup is to wait for price to complete the current wave near 4,475–4,490, then watch for an ABC pullback into 4,385–4,395. If buyers defend that zone, gold may continue toward 4,520–4,530.
Do you think gold will complete wave (5) first, or correct into the buy zone before the next rally? Long 
XAUUSD — Bearish Wave 5 Toward 4,286
Gold is still trading inside a bearish Elliott Wave structure after the strong selloff from the upper area. From Kelly’s view, the current chart suggests that XAUUSD may be forming a wave (4) correction under resistance before continuing lower into wave (5).
The key idea is simple: gold is still below strong resistance, and if buyers fail to reclaim the upper zone, the next bearish target remains around 4,286.
⟡ Market Structure
Gold is currently trading around 4,429, right near the upper side of the FVG support area. After the sharp drop, price has been moving sideways and building a small corrective structure.
The important resistance zone is around 4,455–4,470. This area may act as the wave (4) rejection zone. If price cannot break above it, sellers may continue to control the short-term structure.
Below the current price, the key support is near 4,397. If gold breaks below this level, the bearish wave (5) scenario becomes stronger, opening the way toward the lower liquidity area around 4,286–4,300.
➤ Key Levels
◌ Current price area: 4,429
◌ Strong resistance / wave (4): 4,455–4,470
◌ FVG support zone: 4,365–4,430
◌ Key support: 4,397
◌ Main bearish target: 4,286–4,300
◌ Extended support zone: 4,270–4,310
◌ Bullish invalidation: above 4,507
⌁ Elliott Wave View
The chart is showing a possible bearish 5-wave sequence.
Wave (1) started after the first rejection from the top.
Wave (2) created a recovery bounce but failed to make a stronger continuation.
Wave (3) pushed sharply lower into the FVG support zone.
Wave (4) is now forming as a sideways correction below resistance.
If sellers reject this area again, wave (5) may continue lower toward 4,286–4,300.
This is why Kelly is not chasing buys at the current level. The cleaner plan is to wait for rejection below resistance or a confirmed breakdown below 4,397.
▸ Trading Scenario
Preferred bearish scenario
Entry: Sell around 4,455–4,470 if price gives bearish rejection from strong resistance
Stop Loss: Above 4,507
Take Profit 1: 4,397
Take Profit 2: 4,340–4,320
Take Profit 3: 4,286–4,300
Alternative entry
If gold breaks below 4,397 with strong bearish momentum, sellers may look for continuation toward 4,286 without waiting for a deeper pullback.
◌ Invalidation
The bearish view becomes weaker if gold breaks above 4,507 and holds above that level. In that case, the wave (4) correction may extend higher and the wave (5) downside setup would need to be delayed.
⌁ Kelly’s View
Kelly’s main view remains bearish while gold stays below the strong resistance zone. The current movement still looks more like a correction than a real bullish reversal.
If price rejects 4,455–4,470 or breaks below 4,397, gold may continue the wave (5) move toward 4,286–4,300.
Do you think gold will complete wave (5) first, or will buyers try to defend the FVG support again? Short 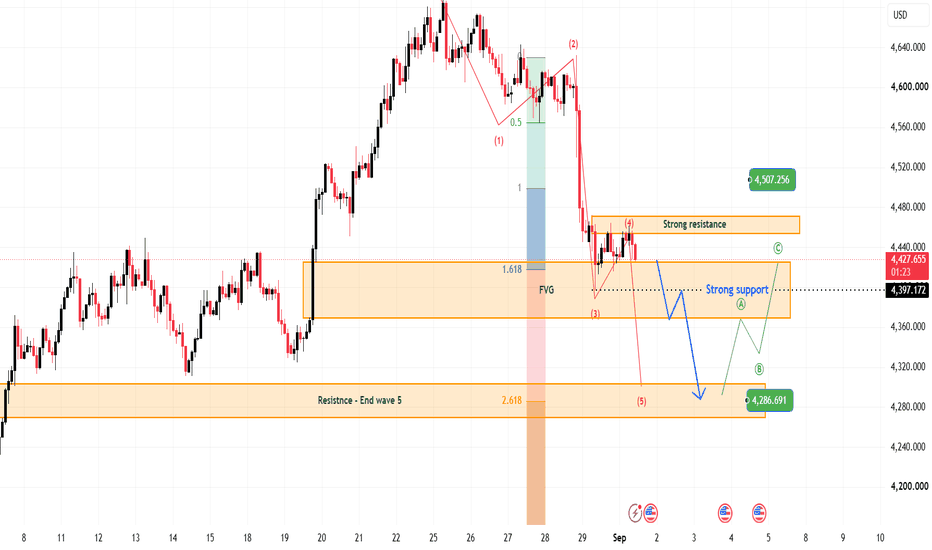
XAUUSD | Trendline Breakout & RetestGold is showing signs of a potential structure shift after breaking above the descending trendline. 📊
🔹 Trendline Breakout → Buyers gained momentum
🔹 Retest Zone → 4,300–4,200
🔹 1D OB + FVG → 4,200–4,100
🔹 First Resistance → 4,600–4,700 🎯
🔹 Major Supply Zone → 4,950–5,050 ⚠️
🔹 Rejection Block → 5,450–5,600
📌 Market Structure
The current setup can be viewed as:
📉 Downtrend → 🚀 Breakout → 🔄 Retest → 📈 Potential Continuation
The 4,300–4,200 area is the key region to watch. A strong reaction from this zone could support further upside, while a decisive breakdown below 4,200–4,100 would weaken the bullish structure. ⚠️
🎯 What I'm Watching
If price successfully holds the retest and continues forming higher highs & higher lows, the next resistance areas come into focus:
4,600 → 4,700 → 4,950–5,050 🚀
Patience is key — confirmation matters more than chasing the move. 🧠📊
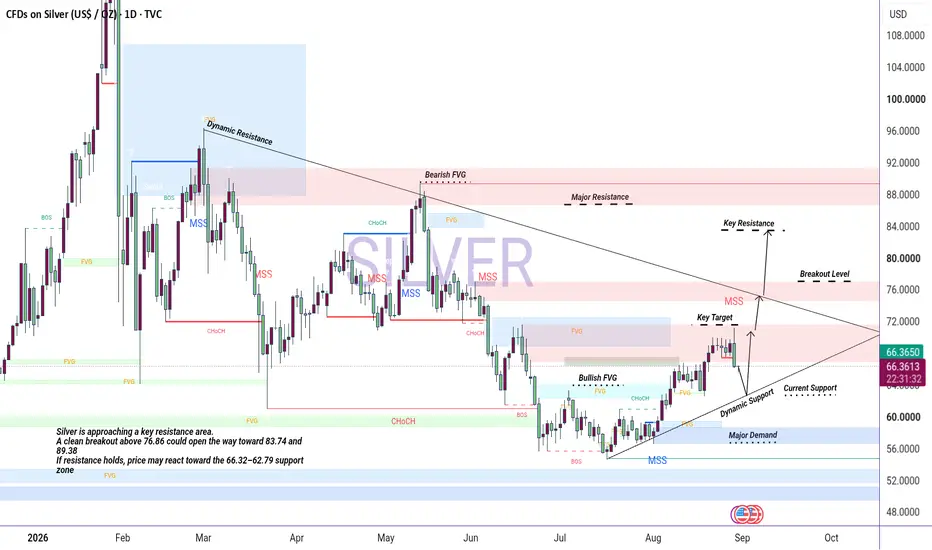
⚠️ This is technical analysis for educational purposes only, not financial advice. Always manage risk and trade according to your own plan. Silver Market Structure & Key Resistance LevelsThis Silver (XAGUSD) 1D analysis focuses on the current market structure, key liquidity levels, Fair Value Gaps (FVG), Market Structure Shifts (MSS), Change of Character (CHoCH), and major support and resistance zones.
The price action shows a clear structural movement from the lower demand areas toward the current trading region. The earlier bullish structure produced multiple BOS signals, while subsequent bearish pressure created several MSS and CHoCH formations. These shifts are important because they show how momentum has changed across different phases of the market.
The upper resistance area around 76.86 is a key level to monitor. A strong daily close above this region could confirm further bullish continuation and potentially expose the higher resistance levels around 83.74 and 89.38. These areas should be treated as important reaction and liquidity zones rather than guaranteed targets.
On the downside, the 66.32 and 62.79 areas represent important support regions. If price fails to maintain the current structure and breaks below these levels, the next major demand area around 56.55 becomes important for monitoring a possible reaction.
The descending trendline is acting as dynamic resistance, while the rising trendline provides dynamic support and creates a compression structure between buyers and sellers. The FVG zones on the chart are also being monitored as potential areas where price may return to rebalance inefficient price movement.
Each candle is read in relation to the surrounding structure, liquidity, momentum, and reaction zones. The objective of this analysis is to understand price behavior and market structure rather than predict every individual candle.
Always wait for confirmation through price action and structure before considering any trade setup. This chart is provided for educational and analytical purposes only, not as financial advice.  Long
Long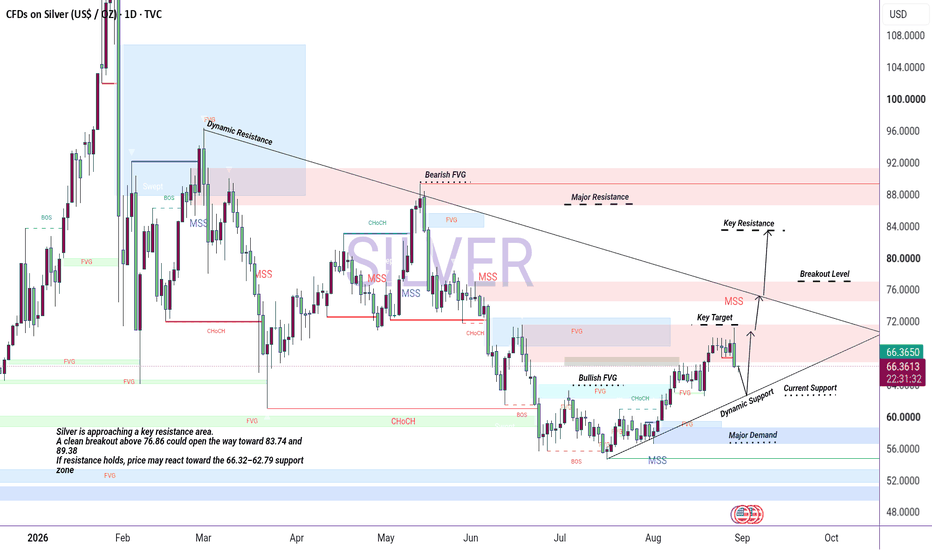
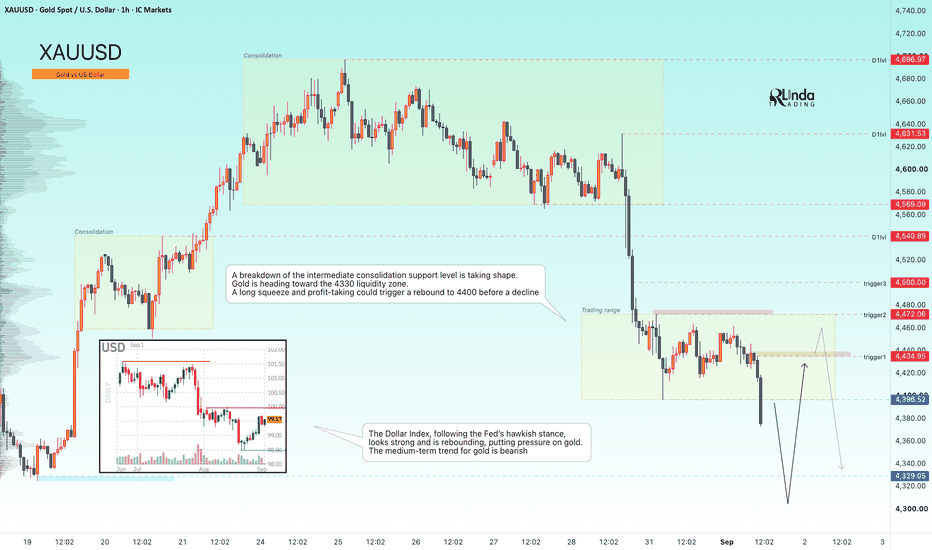
GOLD - Weak fundamentals and a bear market ICMARKETS:XAUUSD remains under selling pressure and continues to decline. Another distribution phase is developing after a short-term consolidation, with the market moving toward the 4,330–4,300 liquidity zone
The Dollar Index looks strong after the Fed adopted a hawkish stance and is bouncing higher, putting further pressure on gold. The medium-term outlook for gold remains bearish.
Gold will remain sensitive to U.S. inflation and labor market data. Central bank purchases and geopolitical risks continue to provide support, but a strong dollar and expectations for higher interest rates are limiting the upside potential. Any recovery attempts could prove short-lived. The key event of the week is Friday’s employment report.
Drivers: hawkish Fed signals, conflict escalation, stronger dollar, rising yields
Resistance levels: 4,400, 4,440, 4,472
Support levels: 4,330, 4,300
A breakout below the support of the intermediate consolidation is developing. Gold is moving toward the 4,330 liquidity zone.
A long squeeze followed by profit-taking could trigger a bounce toward 4,400 before the decline resumes
Best regards,
R. Linda. Short