Short
Short
Trend Persistence and the Psychology of the Trailing Exit● 📊 The Conceptual Origin
- The Nick Rypock Trailing Reverse framework belongs to a family of trend-following overlays whose entire purpose is to answer one deceptively simple question: has the prevailing directional bias been invalidated, or is the current retracement merely noise within an intact structure. The concept emerged from a lineage of thinking that predates modern charting software, rooted in the observation that markets do not move in straight lines but in a sequence of impulsive legs punctuated by corrective pauses, and that a trader's greatest structural risk is not being wrong about direction but being slow to admit that direction has changed.
- Economically, the logic draws from the behavior of trend-persistence itself. Markets exhibit serial correlation over meaningful stretches of time because capital flows are rarely instantaneous; large participants build and unwind positions gradually, and this gradual unwinding creates observable footprints in the form of higher highs and higher lows during an uptrend, or the mirrored sequence during a downtrend. A trailing reverse mechanism is designed to ride this footprint for as long as it remains statistically valid, while stepping aside the moment the footprint breaks down.
- Psychologically, the framework responds to a universal trading affliction: the reluctance to exit a position once conviction has been established. Human beings anchor to their initial thesis and tend to rationalize adverse price action as temporary, which is precisely the blind spot that a percentage-based trailing structure is built to correct. By defining an objective, non-negotiable distance from the extreme price reached during the current trend leg, the framework removes the emotional negotiation from the exit decision entirely.
● 📈 Narrative Technical Analysis
- At its core, the mechanism constructs a dynamic reference line that trails price at a fixed percentage distance from the highest point reached since the current uptrend began, or from the lowest point reached since the current downtrend began. This is a critical distinction from volatility-scaled trailing stops that rely on an average true range multiplier: here, the offset is expressed purely as a percentage of price, which means the trailing distance breathes proportionally with the instrument's own price level rather than reacting to a separate measure of realized volatility.
- The calculation deliberately excludes information carried over from the prior trend. Once a reversal is confirmed, the extreme price that anchored the previous leg is discarded entirely, and a fresh extreme begins accumulating in the new direction. This creates a clean structural break in the reference line's memory, which is conceptually important: the framework never blends bullish and bearish extremes into a single continuous calculation, it treats each trend leg as its own discrete regime with its own anchor point.
- As price advances during an uptrend, the reference line ratchets upward each time a new peak is established, always maintaining the same fixed percentage cushion beneath the highest close or high recorded so far. It never retreats during this phase, meaning that even if price pulls back sharply without breaching the line, the trailing reference does not loosen or widen; it simply holds its most recently ratcheted position. This one-directional ratcheting behavior is what gives the mechanism its trend-locking character, similar in spirit to the way a chandelier-style exit locks in gains, though here the ratchet responds to percentage displacement rather than an average-true-range-derived buffer.
- A reversal is signaled the moment price closes beyond the trailing reference line, at which point the entire calculation flips: the line jumps to the opposite side of price and begins tracking the new extreme in the new direction. This binary, structural flip is what makes the tool function simultaneously as a trend filter and a stop-and-reverse mechanism, since the same calculation that defines the exit for the prior trend also defines the origin point for the next one.
- In terms of consolidation box mapping, sideways regimes reveal one of the framework's more nuanced behaviors. When price oscillates within a tight range, the trailing lines from both sides compress toward one another because neither extreme is being meaningfully extended, and the whipsaw frequency increases as price repeatedly tests both boundaries of the box. Volume profile anomalies often coincide with these compression zones, since thinning participation at the range extremes tends to precede the eventual breakout that resolves the consolidation.
● 🏦 Institutional vs. Retail Perspective
- Institutional desks tend to view a trailing percentage framework as a component within a broader execution and risk overlay rather than as a standalone signal generator. For a desk managing substantial notional exposure, the appeal lies in the mechanism's structural clarity and its ability to be back-tested and parameterized across a portfolio of instruments without requiring discretionary judgment calls at each juncture. Institutional users are typically more concerned with how the trailing distance interacts with liquidity conditions, since a percentage that is appropriate for a liquid large-cap equity may be entirely unsuitable for a thinly traded instrument where normal bid-ask friction alone could trigger premature reversals.
- Retail participants, by contrast, are drawn to the same mechanism for almost the opposite reason: its simplicity and its promise of removing emotional decision-making from the exit process. Where an institutional desk layers the tool within a multi-factor risk model, a retail trader more commonly treats the line itself as the entire trading plan, entering when a reversal is confirmed and exiting when the opposite reversal fires. This difference in application intensity creates very different risk profiles for the same underlying calculation.
- Another point of divergence concerns position sizing discipline. Institutional frameworks generally couple a trailing reverse signal with pre-defined capital allocation rules that scale exposure based on the width of the current trailing distance relative to account equity, whereas retail application frequently overlooks this relationship entirely, applying a static position size regardless of how far the trailing line sits from current price. This oversight is one of the more common sources of asymmetric drawdown among less experienced users of trend-following overlays generally.
● ⚙️ Strategic Variance
- In a trending regime, the framework performs closest to its conceptual ideal. Directional persistence with only shallow counter-trend pullbacks allows the trailing line to ratchet consistently in the direction of the trend, capturing the bulk of a directional move while only sacrificing the final portion of the move once the reversal condition is triggered. This is the environment for which the underlying logic was fundamentally designed, and it is where the mechanism's psychological promise of removing emotional exits delivers its clearest value.
- In a ranging regime, the same mechanism becomes considerably less forgiving. Because the trailing lines on both sides of price compress as extremes fail to extend meaningfully, the frequency of false reversal signals rises sharply. Each whipsaw within a consolidation box represents both a realized transaction cost and a psychological toll, since repeated small losses erode confidence in the framework even when the underlying logic has not itself failed, it has simply been applied in an environment poorly suited to trend-following mechanics.
- In a high-volatility regime, the behavior becomes more nuanced still. Because the trailing offset is a fixed percentage rather than an adaptive volatility measure, sudden expansions in realized volatility can cause the trailing distance to feel either too tight, triggering premature reversals on ordinary volatility spikes, or too loose, allowing an excessive give-back of unrealized gains before a genuine reversal is confirmed. This tension is a direct consequence of the percentage-based design choice rather than a flaw in the underlying concept, and it is precisely why practitioners often adjust the percentage parameter based on the historical volatility character of the specific instrument being traded.
● 🧠 Psychological Architecture
- The deployment of a percentage-based trailing framework is as much an exercise in psychological discipline as it is in mathematical calculation, because the tool's entire value proposition rests on the trader's willingness to honor its signal even when doing so feels premature or counterintuitive. The most common failure mode is not a defect in the calculation itself but the trader's own impulse to override the signal during a reversal, convinced that the trend will resume, which reintroduces precisely the emotional negotiation the framework was designed to eliminate.
- Loss aversion plays a distinct role here as well. Because the trailing line only ratchets in the favorable direction and never loosens, traders often develop an inflated sense of security around unrealized gains, treating the distance between current price and the trailing line as a permanent buffer rather than a probabilistic cushion that can be consumed rapidly during a sharp reversal. This overconfidence is a subtle cognitive trap, since the mechanism's one-directional ratcheting behavior can create the illusion of an ever-widening safety margin even as market conditions deteriorate.
- There is also a recency bias component worth addressing directly. Traders who experience a string of clean trending signals tend to overweight the framework's reliability and underweight the likelihood of an impending ranging phase, only to be caught off guard by a cluster of whipsaws that erode both capital and confidence simultaneously. Recognizing that regime shifts are inevitable, and that no fixed-percentage mechanism can adapt instantaneously to a change in market character, is a core component of using this type of tool responsibly over an extended horizon.
● 🎲 Risk & Probability Sagas
- The philosophical foundation of any trailing-based risk framework is inherently probabilistic rather than deterministic. No fixed percentage distance can be optimized to perform equally well across every possible market regime, and any attempt to curve-fit a single parameter to historical data risks producing a false sense of precision that dissolves the moment market character shifts. The honest framing is that the trailing percentage represents a trade-off between the frequency of premature reversals and the magnitude of give-back on a genuine trend exhaustion, and no parameter selection can eliminate both types of error simultaneously.
- This trade-off is best understood through the lens of asymmetric risk-to-reward construction rather than through any single performance metric viewed in isolation. A wider trailing distance reduces the frequency of false reversals but increases the average give-back on winning trades, while a tighter distance does the opposite, and the appropriate balance depends heavily on the volatility character of the specific instrument and timeframe under consideration, not on a universally optimal constant.
- Ultimately, the mathematical philosophy underlying this class of mechanism accepts that no individual signal can be judged in isolation. Performance emerges only across a sufficiently large sample of trend cycles, ranging phases, and volatility regimes, and any evaluation based on a handful of favorable trending examples is statistically meaningless. Position sizing, therefore, becomes the true governor of long-term survivability, since even a well-calibrated trailing percentage will produce a sequence of losing whipsaws during unfavorable regimes, and only sustainable capital allocation ensures the framework remains viable through that inevitable variance.
Based on the concepts previously discussed, the NRTR Adaptive Trailing Reverse indicator was developed to reflect the academic and technical principles outlined in this article.
● ⚠️ Risk Disclaimer
- This content is provided for educational and informational purposes only and does not constitute financial, investment, or trading advice. Trading and investing in financial markets involves substantial risk, including the potential loss of principal, and past performance of any concept, framework, or methodology discussed here is not indicative of future results. Market conditions are inherently unpredictable, and no analytical framework can guarantee outcomes or eliminate risk entirely. Readers should conduct their own due diligence and consult with a qualified financial professional before making any trading or investment decisions.  Education
Long 
Short 
Projecting RSI Levels Directly onto PriceMost traders use RSI in a separate pane below the price chart. That has been the standard layout for decades, but it creates a translation problem:
RSI is expressed on a bounded 0-100 scale, while the actual decision is made on price.
The RSI Chart Overlay script removes that step by projecting selected RSI levels directly onto the main chart.
The starting point is the RSI 50-line.
In the alternative derivation of RSI , RSI = 50 corresponds to price being equal to the Wilder EMA for the same length. Here, Wilder EMA means Wilder's smoothing, usually implemented as the RMA function with alpha = 1/n.
RSI 50 is the equilibrium point, and its price equivalent is the Wilder EMA of the same length.
Once this relationship is established, the rest of the RSI scale can also be translated into price space.
Traders already know at least three ways of plotting volatility envelopes around moving averages:
Bollinger Bands use standard deviation as a volatility unit
Keltner Channels use ATR
Envelope scripts use a percentage spread around the moving average
In the RSI calculation, a different volatility measure is used: close-to-close changes.
// CC_vol = Wilder’s Exponential Moving Average of absolute close-to-close changes (smoothing factor = 1 / Length)
CC_vol = ta.rma(math.abs(close - close ), Length)
The alternative RSI derivation mentioned above expresses RSI using the distance between price and its Wilder EMA, normalized by a volatility unit based on Wilder-smoothed absolute close-to-close changes and adjusted for RSI length. The resulting values are identical to standard RSI.
In simplified form:
RSI = 50 ×
The thing is that this equation can be read in both directions. Instead of starting with price and calculating RSI, we can start with a chosen RSI value and calculate the corresponding price level.
For a selected threshold "R" , the price-space offset from the Wilder EMA is proportional to:
Price offset from Wilder EMA = (R - 50) / 50 × Volatility Unit × (n - 1)
So RSI 50 sits on the Wilder EMA. A level above 50 is projected above it, while a level below 50 is projected below it. The same logic works for 70/30, 60/40, 80/20, or any other pair.
The projected levels are dynamic, not fixed horizontal thresholds.
The position of the upper/lower bands changes based on:
the Wilder EMA
the volatility unit
RSI length.
When average absolute price movement increases, the price distance associated with a given RSI displacement generally widens. When it decreases, that distance contracts.
A useful way to see this is to compare two occasions when RSI reaches exactly the same level, for example, RSI 70, under different volatility regimes. The RSI reading may be identical, but the corresponding price distance from the Wilder EMA can be very different. In a low-volatility environment, RSI 70 may sit relatively close to the moving average. In a high-volatility environment, reaching the same RSI 70 can require a much larger absolute price displacement. The oscillator shows the same number in both cases; the Overlay shows how different the underlying price geometry can be.
The RSI Chart Overlay therefore does not draw arbitrary envelopes around a moving average. The distance of each line comes directly from the same quantities used to calculate RSI.
There is one technical nuance worth keeping in mind. A projected RSI boundary is the current price-space representation of that RSI level, not a price target calculated once and then frozen. The Wilder EMA and volatility unit update together with new price data, so the entire structure moves.
The main practical benefit is that RSI can now be read in the same coordinate system as price. The RSI distance from the 50-point line becomes visible in price units, and selected upper or lower RSI thresholds become directly observable on the chart.
This also makes the effect of volatility easier to understand. RSI 70 does not correspond to a fixed number of points, dollars, or percentage above the moving average. The required distance depends on recent price movement and RSI length.
The projected levels should not automatically be interpreted as support/resistance or overbought/oversold thresholds.
RSI 70 is not resistance merely because it has been projected onto price, and RSI 30 is not support for the same reason. They are RSI-derived price reference levels. Whether price tends to reject, accept, or move through them is a separate empirical question.
The information stays the same. The coordinate system changes.
The indicator inputs are simple: RSI length, upper/lower RSI boundaries, and optional display settings for the central Wilder EMA and coloring.
One of the best examples of practical use is a monthly BTCUSD chart.
Recent price action brought RSI(14) into the 40-point area. The 40-point threshold is considered by many traders to be "support" in an uptrend. Conversely, 60 points is often considered resistance in a downtrend, so this event attracted a lot of attention.
Looking at the 40/60 thresholds overlaid on the price chart, we can see more than we would by simply checking the RSI pane:
the lower band of the envelope was tested many times
in 2020, RSI(14) never touched the 40-point line, yet the lower wick of the monthly candle touched the lower band of the RSI Chart Overlay
currently the channel is much narrower than in previous instances, meaning the recent bottom formed under lower-volatility conditions
at the same time, we can see where possible resistance may be: the upper band calculated for the 60-point threshold.
The main takeaway is simple:
RSI levels are not detached numbers floating between 0 and 100. They correspond to positions of price relative to its Wilder-smoothed equilibrium and recent movement. RSI Chart Overlay makes that relationship visible directly on the price chart.
Use the script:
RSI Chart Overlay
RSI Tutorials:
RSI Beyond 70/30: Position, Structure, and Adaptive Zones
© AdaptiveRSI
 Education
Education 
NVDA GEX – Market Structure Map Before EarningsNVDA reports after today’s close, with the August 28 options market pricing an approximately ±14-point move through Friday. From spot near 210.15, that frames a rough 196–224 event range.
That range is not a directional forecast or a hard boundary. It does, however, align closely with the current GEX structure: the upper boundary crosses the 220–222.5 call cluster, while the lower boundary reaches through 200 toward 195.
🔶 Earnings / Positioning 🔶
NVDA is trading almost exactly at the 210 HVL, with the transition band extending to 212.5. Although spot is technically above HVL, the margin is minimal, so the stock does not have a clean positive-regime cushion before the event.
An earnings gap may skip intermediate levels. The important information will be where price finds acceptance after the initial reaction.
🔶 Upside Structure 🔶
👉 220 – C3 + CV/nCV : strongest August 28 call-volume strike on the refreshed feed.
👉 222.5 – C2 : sits near the upper expected-move boundary.
👉 230 – C1 : dominant call wall and major structural ceiling.
Confluence at 230:
C1 — highest call NETGEX
Ab1 — largest absolute gamma
COI / nCOI / AbOI — dominant call and total open-interest cluster
D+ — strongest positive delta exposure
This makes 230 the primary upside reaction zone. Acceptance above 222.5 opens 225 and then 230. Only a clear hold above 230 would enter the positive extension zone and create gamma squeeze potential beyond C1.
🔶 Downside Structure 🔶
👉 205 – P3 : first downside reference.
👉 200 – P1 : strongest put wall and major put-side cluster.
👉 195 – P2 : next reference below P1, close to the lower expected-move boundary.
Confluence at 200:
P1 — strongest put wall
POI — highest put open interest
PV / nPV — strongest put-volume concentration
D− — strongest negative delta exposure
A break and acceptance below 200 would enter the negative extension zone, creating downside gamma squeeze risk toward 195.
🔶 Options Sentiment 🔶
CALL$ 32.2% means equivalent-distance calls are priced 32.2% higher than corresponding puts. This is call pricing skew—not a bullish directional signal.
The Options Oscillator’s green histogram is slightly fading from its recent August peak.
IVRank 35.5
IVx 44.1 | IVx 5dCh +0.61%
CALL$ 32.2% — call pricing skew
Implied move approximately ±14 points through August 28
🔶 Technical Context 🔶
50 SMA near 210.95 reinforces the immediate HVL area
200 SMA near 195.81 aligns with P2 and the lower expected-move boundary
🔶 Key Structure to Watch 🔶
210–212.5 — regime pivot and transition band
220–224 — call cluster and upper expected-move area
200–195 — put cluster and lower expected-move area
The key question is whether the post-earnings market accepts above 222.5 and challenges 230—or breaks 200 and extends toward 195.
This material is for educational purposes only and does not constitute investment advice or a recommendation. NVIDIA – Tonight’s Earnings in the SpotlightNVIDIA is the world’s biggest company by market capitalisation with a valuation of $5.16 trillion (August 25th), a considerable distance ahead of Apple in second place who are valued at $4.52 trillion. The sheer size of the company may force stock traders to closely monitor tonight’s quarterly revenue update, released after the market close.
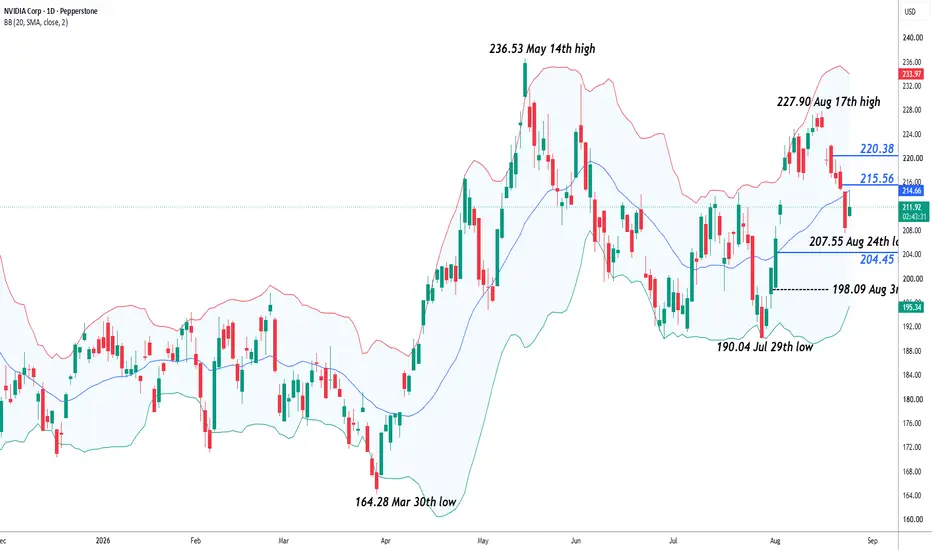
It may be worthwhile noting that as the release day for the company’s much anticipated Q2 earnings have been drawing closer its shares have been under pressure. In fact, before yesterday’s 2.15% rally, the NVIDIA share price had fallen for 7 consecutive sessions, taking the price from 227.90 (August 17th high) down to a low of 207.55 (August 24th low). A key reason for the decline may have been news out last week that NVIDIA’s biggest customers had been told of incoming price rises of 15% for the servers holding their AI chips which helped to weigh on sentiment.
Later tonight, the outcome of the actual earnings release and the earnings call with company executives could be a pivotal moment for the short-term direction of NVIDIA’s share price. Despite the recent uncertainty, expectations are still high for a doubling of revenue on the previous quarter, however traders may also be looking out for insights into the strength of future revenue, the impact of rising costs on margins and how executives see the threat of rising competition in the space.
Technical Update: Earnings to See Deeper Sell-Off Risks?
The latest NVIDIA earnings update, due to be released this evening after the New York close, is set to be an important sentiment driver for the share price and could be watched closely by traders.
Ahead of the release, it can often be useful to reassess the technical backdrop and identify potential key support and resistance levels that may influence the direction of the NVIDIA share price once the results are known.
Potential Key Support Levels
From the August 17th high (227.90) into the August 24th low (207.55), NVIDIA prices have fallen by nearly 9%. However, with a bounce developing during Tuesday’s price activity, it may now be Monday’s low at 207.55 that represents the first key support level. Traders’ initial focus following the earnings release may be on how well this support holds any future declines in price, as breaks below this level could result in further downside momentum.
As the chart above shows, if closes below 207.55 do materialise, focus may shift to the next possible support at 204.45 (61.8% retracement of the July 29th to August 17th strength). If this level were also to give way, the next support may then be 198.09 (August 3rd low), possibly further if that in turn is breached.
Potential Key Resistance Levels
As impressive as Tuesday’s rally may have appeared, price strength remained below a possible resistance level at 215.56 (38.2% retracement of the August 17th to 24th decline) before activity turned lower again into Tuesday’s close. This development could identify the 215.56 level as the first key short term resistance to monitor.
As the chart above shows, if a more sustained period of strength is to develop, successful closes above 215.56 may be needed to shift momentum toward higher levels. Such moves, if seen, could open the way for further upside moves toward 220.38 (61.8% retracement), and possibly then 227.90 (August 17th high).
The material provided here has not been prepared accordance with legal requirements designed to promote the independence of investment research and as such is considered to be a marketing communication. Whilst it is not subject to any prohibition on dealing ahead of the dissemination of investment research, we will not seek to take any advantage before providing it to our clients.
Pepperstone doesn’t represent that the material provided here is accurate, current or complete, and therefore shouldn’t be relied upon as such. The information, whether from a third party or not, isn’t to be considered as a recommendation; or an offer to buy or sell; or the solicitation of an offer to buy or sell any security, financial product or instrument; or to participate in any particular trading strategy. It does not take into account readers’ financial situation or investment objectives. We advise any readers of this content to seek their own advice. Without the approval of Pepperstone, reproduction or redistribution of this information isn’t permitted.
The Confluence Principle in Smoothed Oscillator Desig● 🧠 The Conceptual Origin of Smoothed Momentum Trailing Systems
- The intellectual lineage of this framework traces back to a foundational problem in technical analysis: the raw oscillator, in its native form, is far too erratic to serve as a reliable directional arbiter. Classical momentum measures fluctuate violently on a bar-to-bar basis, generating a stream of noise that obscures rather than reveals the underlying directional current of a market. The conceptual innovation here lies in treating momentum not as a static reading to be compared against fixed thresholds, but as a smoothed, adaptive quantity that develops its own internal trailing reference line, one that only shifts when statistically meaningful movement occurs.
- This approach borrows philosophically from adaptive filtering theory found in signal processing, where a system distinguishes between true signal and background noise by calibrating its sensitivity to the recent volatility of the underlying variable itself. Rather than applying a rigid, one-size-fits-all threshold, the framework's trailing reference expands or contracts based on the average magnitude of recent momentum swings, meaning the system inherently adjusts its tolerance for what constitutes noise versus what constitutes a genuine shift in directional pressure.
- The economic rationale beneath this mechanism is rooted in the belief that price behavior is fractal and regime-dependent: a market in a low-volatility grind requires a tighter trailing sensitivity to detect emerging moves, while a market experiencing expansion requires a wider berth to avoid being whipsawed by transient noise. By anchoring the trailing calculation to a volatility-derived measure rather than a fixed numerical constant, the concept becomes self-adjusting across market conditions without requiring constant manual recalibration by the practitioner.
● 📊 Narrative Technical Analysis
- At its structural core, the framework begins by smoothing a bounded momentum oscillator through an exponential averaging process, producing a curve that reacts to changes in directional pressure while suppressing single-bar noise. This smoothed curve then becomes the input for a secondary layer of analysis: the calculation of an adaptive trailing level derived from the average true range of the smoothed oscillator's own volatility, effectively creating a dynamic band that hugs the smoothed line during stable conditions and widens during turbulent ones.
- The crossing behavior between the smoothed momentum curve and its self-generated trailing level constitutes the primary structural event of the entire framework. When the smoothed curve breaches its trailing boundary from below, this is interpreted as the exhaustion of selling pressure and the beginning of an accumulation phase; the inverse breach, from above to below, signals the exhaustion of buying pressure and a transition toward distribution. These crossing events are not treated as isolated occurrences but as milestones within a broader structural narrative of the underlying trend's maturation cycle.
- A secondary confluence layer, calculated at a different sensitivity setting, serves as a corroborating witness to the primary signal. This dual-pathway architecture echoes the logic of consolidation box mapping, where a market's structural integrity is only confirmed once multiple independent measures agree on directional bias. When both the fast-reacting and slow-reacting layers align in their assessment of trend direction, the resulting confluence carries substantially more probabilistic weight than either measure would in isolation, reducing the incidence of false starts that plague single-layer momentum systems.
- The framework further incorporates an optional directional strength filter derived from the divergence between positive and negative directional movement, a classical measure of trend conviction. This filter acts as a gatekeeper, ensuring that momentum-based crossing events are only granted significance when the broader market structure exhibits sufficient directional strength, thereby filtering out crossings that occur during genuinely rangebound, directionless conditions where momentum signals are structurally unreliable regardless of their apparent clarity.
- A higher-timeframe bias filter introduces a top-down structural hierarchy into the analysis, requiring that a lower-timeframe signal align with the prevailing bias calculated on a broader temporal canvas. This reflects a well-established principle in multi-timeframe market structure theory: that the higher timeframe establishes the dominant liquidity shelf and the lower timeframe merely offers tactical entry timing within that broader structural context, never contradicting it.
- Volatility itself is metabolized into the framework's risk architecture through an average true range calculation that translates raw price volatility into proportional distance measures for protective and target levels. This creates a self-scaling risk framework that adapts its absolute price distances to the instrument's current volatility regime, avoiding the structural flaw of static, arbitrarily fixed distances that become either meaninglessly tight or excessively wide as volatility conditions evolve.
● 🏛️ Institutional vs. Retail Perspective
- Institutional market participants approach smoothed momentum trailing systems through the lens of order flow validation rather than standalone signal generation. For a desk managing substantial capital, a momentum crossing event is never sufficient justification for position initiation on its own; instead, it functions as one confirming data point layered atop volume profile analysis, liquidity mapping, and an assessment of where resting orders are likely concentrated. The institutional view treats the smoothed trailing level as a probabilistic filter that reduces the search space of viable entries, not as an autonomous decision-making mechanism.
- Retail participants, by contrast, frequently gravitate toward treating a single crossing event as a complete and sufficient trading thesis, extracting the signal from its broader structural context and applying it mechanically across instruments and timeframes without regard to the surrounding liquidity environment. This tendency toward signal literalism, divorced from an appreciation of the deeper mechanics of consolidation box formation and volume distribution, represents one of the most persistent sources of underperformance among less experienced practitioners.
- The confluence architecture embedded in the dual-layer design partially bridges this gap by imposing a structural requirement that mirrors, in simplified form, the institutional practice of seeking multiple independent confirmations before acting. Where an institutional desk might synthesize order flow, volume delta, and macro positioning data, the confluence mechanism synthesizes fast and slow momentum readings, offering the retail practitioner a rudimentary analog to the multi-factor validation process employed by more sophisticated market participants, albeit without direct access to the order-flow data that ultimately drives institutional conviction.
- A further point of divergence concerns time horizon and patience. Institutional capital, often constrained by mandate and benchmark considerations, can afford to wait through extended periods of ambiguous signal behavior in pursuit of high-conviction setups, whereas retail practitioners frequently exhibit an urgency bias, feeling compelled to act on every crossing event regardless of the surrounding higher-timeframe context, a behavioral asymmetry that the higher-timeframe bias filter is conceptually designed to counteract by enforcing a measure of top-down discipline.
● ⚙️ Strategic Variance Across Market Regimes
• Trending Conditions
- In a well-established trending regime, this class of framework approaches its conceptual ideal. Directional persistence produces momentum readings that remain consistently on one side of the adaptive trailing level for extended durations, punctuated only by shallow, temporary crossings during minor corrective pullbacks that the trailing mechanism, by design, is calibrated to absorb without triggering a full reversal signal. The directional strength filter, when engaged, further reinforces signal quality during these conditions by confirming that the measured conviction behind the trend remains structurally intact.
• Ranging Conditions
- Rangebound, directionless markets represent the most challenging environment for any momentum-trailing architecture, this one included. In the absence of sustained directional pressure, the smoothed momentum curve oscillates around its trailing level with far greater frequency, generating a higher density of crossing events that carry diminished predictive value. It is precisely within this regime that the directional strength filter and the multi-layer confluence requirement earn their conceptual keep, suppressing a meaningful proportion of the false signals that would otherwise proliferate during structurally ambiguous, low-conviction sideways action.
• High Volatility Conditions
- During episodes of volatility expansion, such as those accompanying macroeconomic announcements or sudden liquidity shocks, the adaptive nature of the trailing calculation becomes both a strength and a source of complexity. The trailing level widens in response to the surge in underlying momentum volatility, which helps prevent premature signal reversal but simultaneously introduces greater lag into the system's responsiveness. The volatility-derived risk architecture governing protective and target distances also expands correspondingly, meaning that position sizing and risk tolerance must be reassessed by the practitioner during these regimes, since the same nominal risk parameter translates into a materially different absolute price distance than it would during calmer conditions.
● 🧠 Psychological Architecture
- The implementation of any smoothed trailing framework is as much an exercise in psychological discipline as it is in mathematical construction, because traders are consistently poor judges of their own real-time risk tolerance once capital is genuinely at stake. The very design of a trailing mechanism, one that deliberately resists reversing on minor countertrend movement, exists precisely because human cognition tends toward premature signal abandonment, exiting positions at the first sign of adverse movement rather than allowing a statistically sound framework to run its intended course.
- Loss aversion, the well-documented tendency to feel the pain of a loss more acutely than the pleasure of an equivalent gain, manifests acutely in the practitioner's relationship with confluence-based systems. When the fast and slow layers of momentum diverge, or when a higher-timeframe filter contradicts a lower-timeframe signal, the practitioner experiences genuine cognitive discomfort, an urge to override the system's built-in patience in favor of immediate action. Resisting this urge, and allowing the structural hierarchy of the framework to filter out premature entries, represents one of the more difficult psychological disciplines a systematic trader must cultivate.
- Confirmation bias presents a further persistent threat to the disciplined application of any multi-filter framework. A practitioner predisposed toward a bullish thesis will naturally place disproportionate emphasis on the bullish-aligned filters while mentally discounting a bearish higher-timeframe bias or a failed directional strength confirmation, effectively deconstructing the very confluence architecture that was designed to protect against exactly this form of selective reasoning. Genuine discipline requires treating every filter component as equally weighted evidence, regardless of which conclusion the practitioner privately favors.
- The waiting period inherent in multi-layer confirmation systems also imposes a distinct form of psychological friction often described as the fear of missing out. As momentum begins shifting on the fast layer while the slower confluence layer has not yet confirmed, practitioners frequently feel compelled to front-run the system's own logic, entering before all structural conditions have been satisfied. This impulse undermines the statistical edge that the multi-filter design was constructed to provide, since the very purpose of layered confirmation is to accept a marginally later entry in exchange for a materially higher probability of directional correctness.
● 🎲 Risk & Probability Sagas
- The mathematical philosophy underpinning the risk architecture of this framework rests on the principle of volatility-normalized position construction, wherein protective distances are expressed not as fixed price increments but as multiples of a rolling measure of average true range. This approach acknowledges a fundamental truth of market behavior: risk cannot be meaningfully quantified in absolute price terms across changing volatility regimes, since a given nominal distance might represent a trivial fluctuation during high-volatility conditions and an enormous, disproportionate risk during quiet, low-volatility conditions.
- Extending this volatility-normalized foundation, the framework's approach to reward targets follows a proportional risk-to-reward architecture, where potential profit objectives are calculated as direct multiples of the initial risk distance rather than as arbitrary price levels. This reflects a deeper probabilistic truth embedded in professional risk management: the long-run viability of any systematic approach depends not on the win rate of any individual signal but on the asymmetry between the magnitude of realized gains relative to realized losses across a sufficiently large sample of occurrences.
- The philosophical foundation of layered profit-taking, structured across multiple sequential reward tiers rather than a single binary exit point, acknowledges the inherent uncertainty of forecasting the full extent of any directional move. By partitioning the reward objective into successive tiers, the framework implicitly recognizes that no single practitioner, and no single mathematical model, can reliably predict the precise termination point of a market movement in advance, and that a probabilistic distribution of partial exits produces a smoother, more statistically robust equity trajectory than an all-or-nothing wager on a single terminal target.
- Ultimately, the probabilistic saga embedded within any risk-normalized framework is one of humility before uncertainty. No combination of filters, confluences, or adaptive trailing calculations can transform an inherently probabilistic endeavor into a deterministic one. The mathematics of asymmetric risk-to-reward exists not to eliminate the possibility of loss but to ensure that the accumulated weight of favorable asymmetries, compounded across a sufficiently large number of occurrences, produces a statistically sound expectation over time, provided the practitioner maintains the discipline to apply the framework consistently rather than selectively.
Based on the concepts previously discussed, the QQE Trend Confluence indicator was developed to reflect the academic and technical principles outlined in this article.
● ⚠️ Risk Disclaimer
- The concepts discussed in this article are presented for educational and analytical purposes only and do not constitute financial advice, investment recommendations, or a guarantee of future performance. Trading and investing in financial markets involves substantial risk of loss and is not suitable for every individual. Past behavior of any market structure or momentum-based framework does not guarantee similar behavior in the future, and market conditions are inherently unpredictable. Readers should conduct their own independent research and consult with a qualified financial professional before making any trading or investment decisions. Any application of the concepts described herein is undertaken entirely at the reader's own discretion and risk.  Education
Goldman Sachs Could Be Breaking OutGoldman Sachs has pulled back after hitting record highs, and some traders may think it’s breaking out.
The first pattern on today’s chart is the rally on July 14 after earnings beat estimates. That may reflect bullish fundamentals.
Second, the Wall Street bank made a series of lower highs from late July through last week. It closed above that falling trendline yesterday -- plus its 50-day simple moving average. That might be viewed as a breakout.
Third, GS bottomed around $1,000 in early July and $980 in late July. It bounced slightly above $1,000 again last week. The rounded basing pattern could suggest it’s built support around the four-digit mark.
Fourth, tightening Bollinger Bandwidth highlights the stock’s narrow range of motion. That volatility squeeze might create space for prices to expand.
Finally, the 8-day exponential moving average (EMA) is nearing a potential cross above the 21-day EMA. That could reflect an improving short-term trend.
TradeStation has, for decades, advanced the trading industry, providing access to stocks, options and futures. If you're born to trade, we could be for you. Learn more here about TradingView’s Broker of the Year!
Past performance, whether actual or indicated by historical tests of strategies, is no guarantee of future performance or success. There is a possibility that you may sustain a loss equal to or greater than your entire investment regardless of which asset class you trade (equities, options or futures); therefore, you should not invest or risk money that you cannot afford to lose. Online trading is not suitable for all investors. View the document titled Characteristics and Risks of Standardized Options at www.TradeStation.com . Before trading any asset class, customers must read the relevant risk disclosure statements on www.TradeStation.com . System access and trade placement and execution may be delayed or fail due to market volatility and volume, quote delays, system and software errors, Internet traffic, outages and other factors.
Securities and futures trading is offered to self-directed customers by TradeStation Securities, Inc., a broker-dealer registered with the Securities and Exchange Commission and a futures commission merchant licensed with the Commodity Futures Trading Commission). TradeStation Securities is a member of the Financial Industry Regulatory Authority, the National Futures Association, and a number of exchanges.
TradeStation Securities, Inc. and TradeStation Technologies, Inc. are each wholly owned subsidiaries of TradeStation Group, Inc., both operating, and providing products and services, under the TradeStation brand and trademark. When applying for, or purchasing, accounts, subscriptions, products and services, it is important that you know which company you will be dealing with. Visit www.TradeStation.com for further important information explaining what this means. Short 
Right Direction, Wrong Outcome: 3 Clocks in a 15-Minute BTC MoveMost short-window BTC mistakes begin with a statement that can be completely true:
“Bitcoin is moving up.”
The mistake is treating that statement as a complete decision.
Inside a fixed 15-minute window, three moving variables—or “clocks”—are running at the same time:
1. Direction: Which side currently controls price?
2. Distance: Where is price relative to the relevant target?
3. Time: How much of the window and measurement process remains?
A trader can read the first clock correctly and still reach the wrong conclusion because the other two clocks disagree.
1. The Direction Clock
Direction is what most traders notice first.
Price breaks upward. Momentum increases. A large green candle forms. The immediate conclusion is “Up.”
That move is evidence, but it is not the entire answer.
An upward impulse could represent:
- Sustainable continuation
- A temporary liquidity sweep
- Short covering
- The final burst before exhaustion
- Noise inside a larger range
Direction should therefore be judged through structure and follow-through:
- Are highs and lows advancing?
- Does price hold after the initial impulse?
- Are pullbacks being absorbed?
- Is momentum expanding or already fading?
Direction describes the current condition. It does not promise where price will be several minutes later.
2. The Distance Clock
Being bullish is not the same as being close enough to clear a specific target.
Suppose BTC is moving upward while remaining $40 below the relevant threshold. Whether that gap is small or large depends on current volatility.
A $40 move may be ordinary during fast expansion and unusually large during quiet compression.
A useful comparison is:
Target distance ÷ recent typical short-term movement
Distance must also be measured against the correct chart reference.
Different BTC feeds can display slightly different prices because they use different exchanges, currency pairs, liquidity, and calculation methods. A target taken from one reference may not belong at the identical visible price on another chart.
Conceptually:
Mapped target = Official target + Estimated chart-to-reference difference
That difference is not necessarily permanent. It can expand or contract during fast conditions, so a mapped target remains an estimate—not a guarantee.
3. The Time Clock
The same signal can mean something entirely different depending on when it appears.
Consider the same situation:
BTC is moving upward and sits $25 above a mapped target.
With 12 minutes remaining, there is substantial time for continuation, consolidation, or complete reversal.
With four minutes remaining, holding above the target may carry more information—but volatility can still erase the lead.
With 20 seconds remaining, there is less time for a large reversal, but the final visible tick may not be the deciding measurement.
Some short-duration contracts use an averaging window rather than one last price. If that applies, a late print above the target may not be enough to pull the entire average above it.
Always understand what is actually being measured:
- One trade?
- One closing price?
- An index?
- An average across multiple observations?
A chart can be accurate for its own data source while still differing from another benchmark or settlement calculation.
When the Three Clocks Agree
A more coherent short-window setup exists when:
- Direction shows sustained control
- Distance is reasonable relative to current movement
- Remaining time supports the move
- Price is holding rather than repeatedly crossing the target
- The measurement method is understood
Even then, the outcome is not guaranteed.
When the clocks disagree, caution matters more than conviction.
Examples include:
- Strong direction but an unrealistic target gap
- Price above the target but excessive time remaining
- Very little time remaining while price is trapped inside normal noise
- A late reversal that invalidates the original directional read
- An unstable difference between the chart and reference source
The No-Decision State
The most overlooked short-window decision is not choosing either side.
When price repeatedly crosses the target, momentum keeps reversing, or the target sits inside ordinary noise, the market may not be offering a clean conclusion.
That is not a failure to analyze.
It is the analysis.
Forcing an Up or Down opinion every 15 minutes turns uncertainty into impulse. A disciplined framework must be allowed to say:
- Direction unclear
- Target contested
- Time insufficient
- Conditions unstable
- No decision
A Pre-Decision Checklist
Before making any short-window BTC decision, ask:
1. Which BTC data source am I viewing?
2. What exact target or reference is being measured?
3. Does that target need to be mapped onto my chart?
4. How large is the target gap relative to recent movement?
5. How much time remains?
6. Is price expanding, compressing, churning, or reversing?
7. Does the outcome use one price or a measurement window?
8. What condition would invalidate the current read?
9. Is this genuinely clear—or am I forcing an answer?
Final Takeaway
Direction is only one part of a time-limited BTC decision.
Target mapping explains where price needs to be. Volatility gives the distance context. Time determines how much opportunity remains for continuation or reversal.
No tool can remove uncertainty. A useful chart should organize the evidence, expose disagreement, and make uncertainty harder to ignore—not turn a probabilistic decision into a promise.
The goal is not to force an Up or Down answer every 15 minutes.
The goal is to recognize when direction, distance, and time agree—and when the honest answer is no decision. Education 
US 100 – Event Risk Keeping Volatility ElevatedIt’s a rarity for a week to go by in financial markets without technology stocks that dominate the US 100 index, grabbing the headlines in some form and it seems that this week is no exception. Sentiment and prices dipped early on Monday after Alibaba raised $10 billion in Hong Kong’s biggest ever secondary share sale to help fund its goal of being a global AI leader. This brought back concerns about the size of AI capital expenditure to the fore which saw chipmakers within the US 100 fall and led the index to drop from its initial highs around 29404 down to a low of 28873 before some dip buying stemmed the decline.
Traders are already on edge this week as it is, with Nvidia, the AI bellwether and world’s most valuable company, due to release its latest results after the close on Wednesday. Nvidia carries the biggest weighting in the US 100 and option markets are currently pricing in the chance of a 4.6% move in the stock post results according to Bloomberg, a move that if it happened could have a significant impact on US 100 index volatility.
Not only that but traders are also monitoring the response from Iran to the US switching its approach from missile strikes to a strategy of economic isolation to potentially bring some form of resolution to the Middle East conflict. How Tehran responds could also be an important factor influencing sentiment towards US indices.
Then finally on Friday, Fed Chair Kevin Warsh is due to deliver his keynote speech from the Fed’s Jackson Hole Symposium at 1500 BST. US 100 traders may be influenced by his views on US government finances, surging bond yields and central bank independence. Any updates he provides on interest rate policy could also be of pivotal importance given the uncertainty about what US policymakers may decide when they next meet on September 16th.
Technical Update: 29039 The First Key Support Focus?
While the period of price strength seen in the US 100 index between the July 29th low at 27050 and the August 17th high of 30246 was an impressive move, it appears the upside momentum may have failed against a potentially strong resistance band from which price weakness emerged last week.
This resistance band stands between 30246 all the way up to 30776 and equates to a series of previous failure highs posted between June 3rd and August 17th. Traders may view this series of highs as a strong barrier to further upside and could well be an important resistance area to monitor.
On the downside, the first key support focus could be 29039. This level is equal to the 38.2% Fibonacci retracement of the July 29th to August 17th strength. While this level was tested on Monday, it held on a closing basis, adding to its potential as an important support to watch in the short term.
Potential Resistance Levels:
While the previous cluster of highs between 30246 and 30776 may be the key resistance range, there could be a lower level for traders to monitor at 29580 which is equal to half of the latest decline. Closing breaks above 29580 could increase potential for a more sustained retest of the August 17th peak at 30246, possibly higher.
However, as outlined earlier in the technical update, for upside momentum to be reestablished it may take closes above the June 3rd high at 30776 to confirm potential for further gains toward 32212 (38.2% Fibonacci extension of the June 3rd to July 29th decline), then 33102 (61.8% extension).
Potential Support Levels:
Currently, the first potential support level at 29039 (38.2% retracement) is still holding the current phase of weakness and closes below this level may be necessary to indicate that risks are turning toward renewed declines.
Closing breaks below 29039 could lead to further downside momentum, opening scope toward 28551 (50% retracement), and then possibly the deeper 61.8% retracement at 28255.
The material provided here has not been prepared accordance with legal requirements designed to promote the independence of investment research and as such is considered to be a marketing communication. Whilst it is not subject to any prohibition on dealing ahead of the dissemination of investment research, we will not seek to take any advantage before providing it to our clients.
Pepperstone doesn’t represent that the material provided here is accurate, current or complete, and therefore shouldn’t be relied upon as such. The information, whether from a third party or not, isn’t to be considered as a recommendation; or an offer to buy or sell; or the solicitation of an offer to buy or sell any security, financial product or instrument; or to participate in any particular trading strategy. It does not take into account readers’ financial situation or investment objectives. We advise any readers of this content to seek their own advice. Without the approval of Pepperstone, reproduction or redistribution of this information isn’t permitted.  Long
Long
Long