免费,直到您准备好走得更远
首先查看所有市场的表现,
然后进入100百万交易者使用的平台。
无需信用卡
各种方案能满足各种雄心
方案比较
| Basic | Essential | Plus | Premium | Ultimate |
|---|
图表 | Basic | Essential | Plus | Premium | Ultimate |
|---|---|---|---|---|---|
每个标签页的图表数量 | 1 | 2 | 4 | 8 | 16 |
Saved chart layouts | 1 | 5 | 10 | ||
Custom chart intervals | |||||
Predefined second intervals | |||||
Custom second intervals | |||||
基于tick的时间周期 | |||||
Intraday price-based charts | |||||
Custom range bars | |||||
Spread charts | |||||
数据导出 | |||||
可自定义的图表类型 | 17 | 17 | 17 | 21 | 21 |
Symbol comparison | |||||
股息调整后的图表 | |||||
Interactive corporate events and news | |||||
Historical annual financial data | 7年 | 20年 | 20年 | 20年 | 20年 |
Historical quarterly financial data | 8年 | 8年 | 8年 | 8年 | 8年 |
延时交易时段 | |||||
Parallel chart connections | 2 | 10 | 20 | 50 | 200 |
Nested drawing groups | |||||
| Bar replay | |||||
日图及以上时间周期的历史数据 | 全部 | 全部 | 全部 | 全部 | 全部 |
按分钟计算的历史数据 | 180天 | 365天 | 全部 | 全部 | |
按秒计算的历史数据 | 全部 | 全部 | |||
按tick的历史数据 | 7天 | ||||
Indicators replay | |||||
Trading in bar replay | |||||
| 技术分析 | |||||
400多个预设的热门指标 | |||||
150K+ community-powered indicators | |||||
Indicators on indicators | 1 | 1 | 9 | 24 | 49 |
每个图表的指标 | 2 | 5 | 10 | 25 | 50 |
每张图表的财务数据 | 1 | 4 | 7 | 10 | 25 |
自定义指标模板 | 1 | ||||
110+ drawing tools | |||||
成交量蜡烛 | |||||
Pine Script® | |||||
K线形态识别 | |||||
自动斐波那契回撤 | |||||
多时间周期分析 | |||||
计算时间限制 | 20 sec | 40 sec | 40 sec | 40 sec | 100 sec |
自动图表形态 | |||||
| Orderflow | |||||
Volume profile indicators | |||||
Time price opportunity | |||||
成交量轨迹 | |||||
| Strategy backtesting | |||||
基本报告指标 | |||||
高级报告指标 | |||||
Export trades in CSV | |||||
以XLSX格式导出报告 | |||||
深度回测 | |||||
High detalization of historical bars | |||||
每个历史tick执行 | |||||
| 自选表 | |||||
自选表数量 | 1 | ||||
每个自选表的商品 | 30 | 1,000 | 1,000 | 1,000 | 1,000 |
已标记商品的颜色 | 1 | 7 | 7 | 7 | 7 |
Import and export | |||||
自定义列和排序 | |||||
| 投资组合 | |||||
投资组合数量 | 1 | 3 | 4 | 5 | 7 |
每个投资组合的持股 | 20 | 50 | 75 | 100 | 150 |
每个投资组合的交易 | 2,000 | 5,000 | 5,000 | 5,000 | 5,000 |
Broker account connections via Plaid | 3 | 3 | 3 | 3 | |
| 警报 | |||||
有效价格警报 | 3 | 20 | 100 | 400 | 1,000 |
Active technical alerts | 20 | 100 | 400 | 1,000 | |
有效自选表警报 | 2 | 15 | |||
Alert duration | 1 month | 2 months | 2 months | ||
Webhook通知 | |||||
多条件警报 | |||||
Alerts on financial metrics | |||||
秒级警报 | |||||
| 筛选器 | |||||
Stock, ETF, bond, crypto screeners | |||||
来自50多个国家的150多家交易所 | |||||
500+基本面和技术指标 | |||||
多个市场 | |||||
图表视图模式 | |||||
自选表作为过滤器 | |||||
AI Screener requests | Preset requests only | 100 | 150 | 250 | 500 |
已标记商品的颜色 | 1 | 7 | 7 | 7 | 7 |
Auto-refresh | 10 sec / 1 min | 10 sec / 1 min | 10 sec / 1 min | 10 sec / 1 min | |
数据导出 | |||||
时间周期 | D W M | 全部 | 全部 | 全部 | 全部 |
Pine筛选器 | |||||
债券筛选器 | |||||
Saved screens | 1 | ||||
Active filters | 2 | ||||
Manual filter setup | |||||
Adding columns | |||||
Custom grid in chart view | |||||
Date range selection in chart view | |||||
| 数据 | |||||
最快的数据流 | |||||
允许最大的市场数据订阅数量 | 2 | 4 | 6 | ||
Ability to buy professional market data | |||||
提供历史K线 | 5K | 10K | 10K | 20K | 40K |
Fundamental stock data | |||||
全球财经数据 | |||||
Unlimited access to all news sources | |||||
热门榜 | |||||
Economic, IPO, earnings, and dividend calendars | |||||
Yield Curves | |||||
| 交易 | |||||
Trading through selected brokers | |||||
模拟交易 | |||||
图表交易 | |||||
Depth of market (DOM) trading | |||||
有效的社区竞赛 | 3 | 5 | 10 | 25 | |
创建公开竞赛的能力 | |||||
| 期权 | |||||
Number of strategies | 3 | 8 | 15 | 25 | |
| 社交 | |||||
您名字旁的专属徽章 | |||||
Signature and website fields | |||||
Posting invite-only indicators | |||||
Posting protected scripts | |||||
Posting public ideas and scripts | |||||
Posting video ideas | |||||
Posting minds | |||||
Commenting on public ideas and scripts | |||||
| 无广告 | |||||
图表 | |||||
社交网络 | |||||
| 移动app | |||||
始终在您的指尖 | |||||
Fully synced | |||||
本机推送警报通知 | |||||
Android and iOS widgets | |||||
| 电脑版应用程序 | |||||
电脑版体验 | |||||
本机多显示器支持 | |||||
在视窗之间通过商品连接标签页 | |||||
| 客服 | |||||
客户服务 | Regular | Priority | Priority | First priority |
街知巷闻
我们几乎在每个城市都有业务。当您在这个水平上运作时,您就拥有了最好的数据。
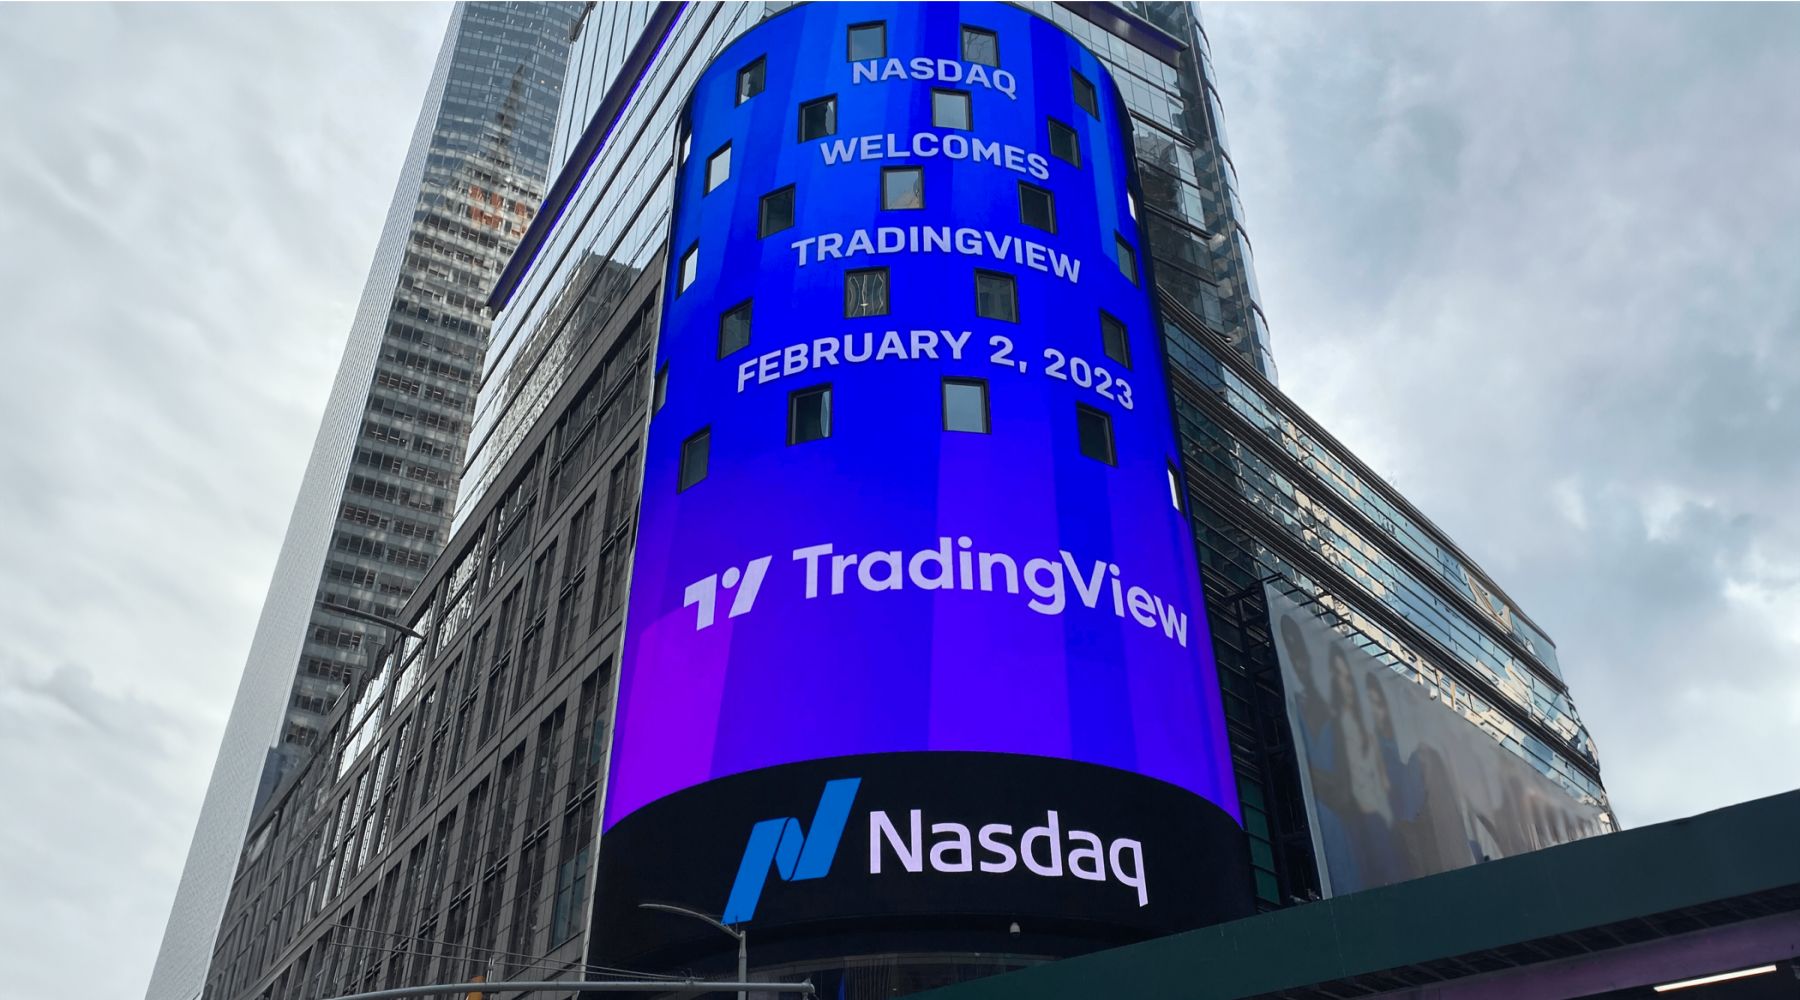
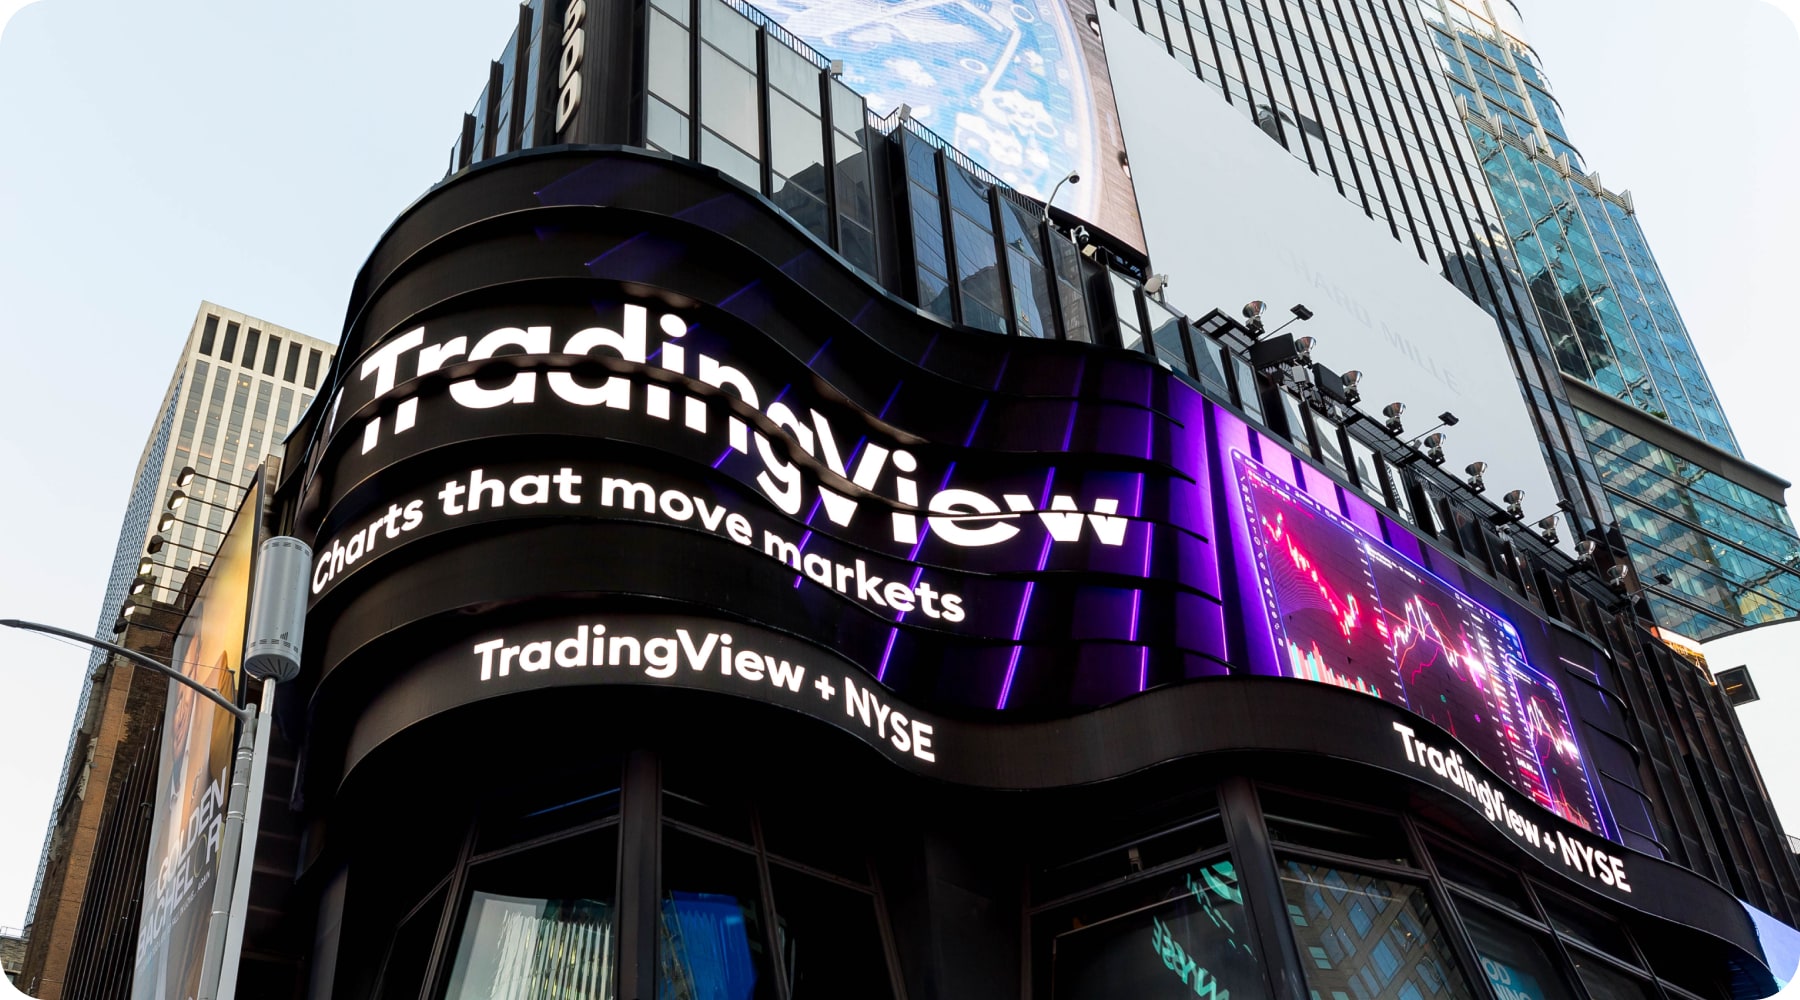
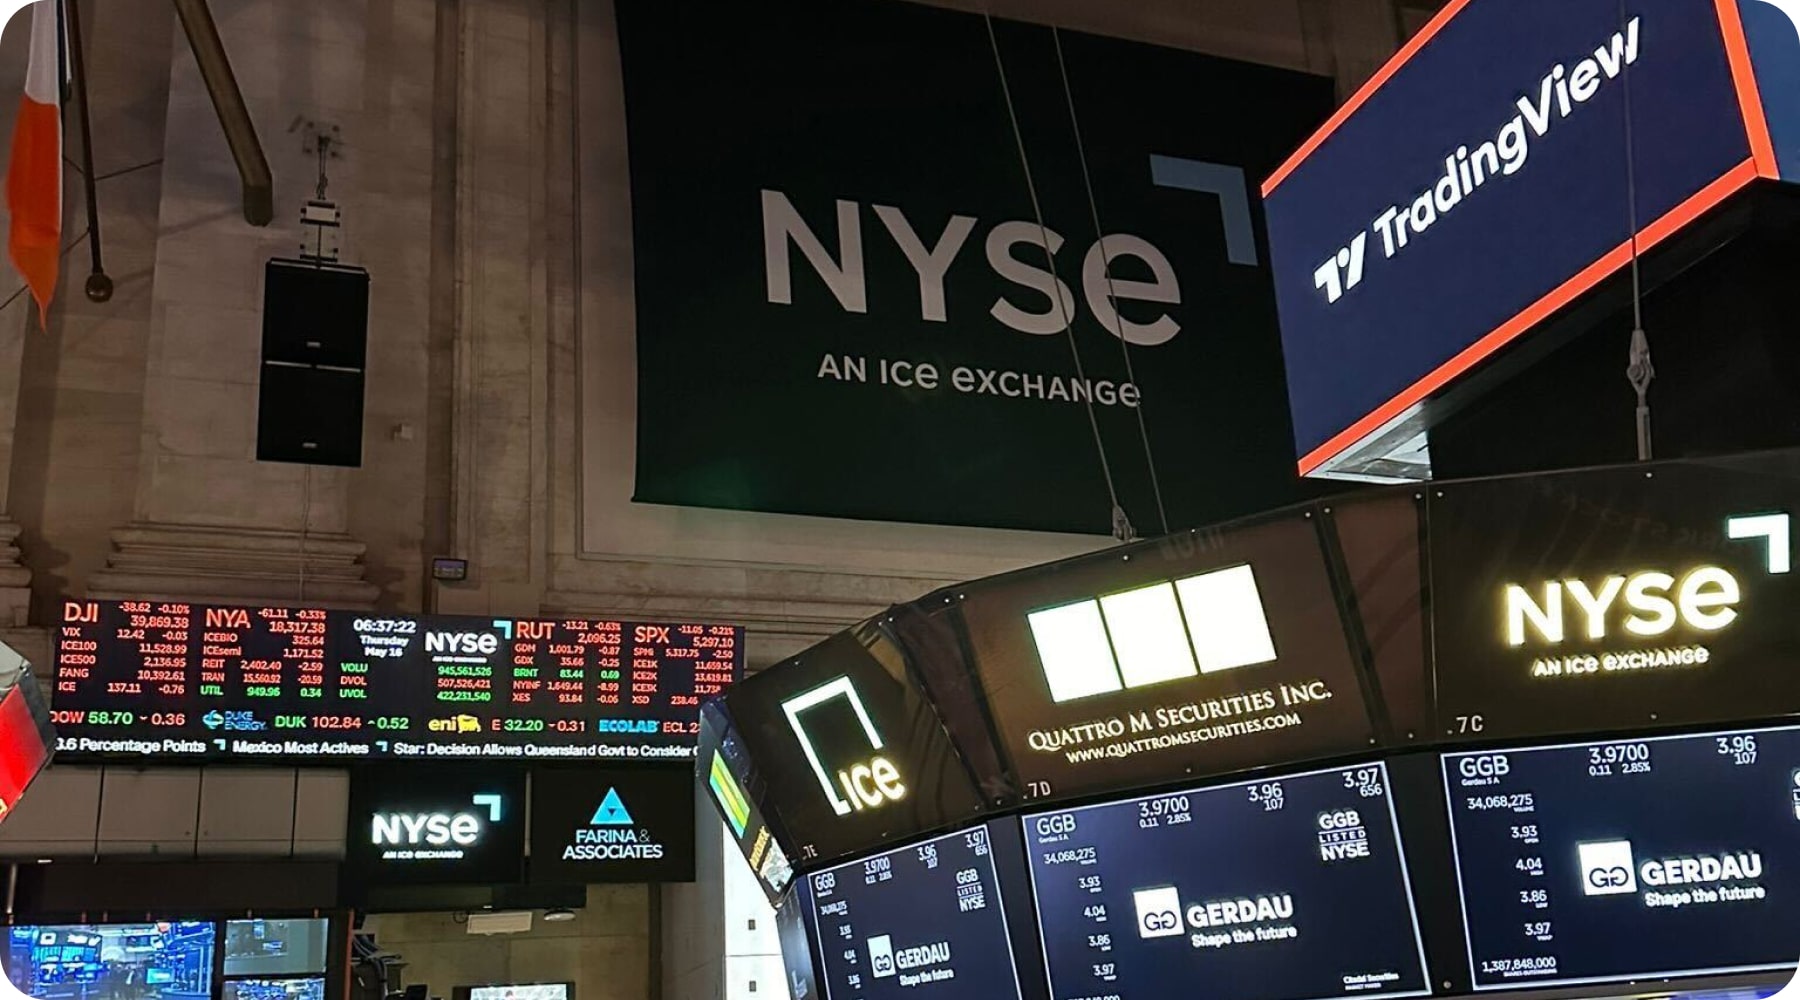
打个招呼,华尔街✌️
顶层信息对交易者来说意义重大。这就是为什么我们在世界上最著名的街道上与最好的机构数据伙伴合作,甚至远远超过它。
















常见问题解答
是的 — 您的付款是安全的。TradingView不会存储您的任何付款凭证。您的付款信息经过安全加密,并通过API直接传递给支付提供商,例如Braintree(PayPal旗下公司)、Checkout、Razorpay、dLocal和Triple-A。这些安全连接确保您在管理订阅时获得安全、便捷和可靠的体验。
可接受的付款方式包括所有主要信用卡、PayPal帐户、Apple Pay和加密货币付款。此外,在我们的移动app上,您可以使用App Store,或Google Play支持的任何付款方式。
是的,您可以使用加密货币支付月度和年度方案费用 — 直接支付或通过Binance Pay。付款由Triple-A安全处理。要使用加密货币支付,请在订单页面上选择“加密货币”标签页,然后按照屏幕上的说明操作。
您可以随时取消订阅,并且在当前付费期限后不会自动续订。付费服务将在付费期限内保持有效。取消的试用将在取消后立即停止。
退款仅适用于年度方案,且必须在付款后14个自然日内申请。如需申请退款,请联系我们的客服团队。升级到更贵的方案、月度方案或市场数据均不予退款,即使在付款当天取消订阅亦是如此。请注意,已提交拒付/争议申请或索赔的用户不符合退款资格。
您可以随时升级年度订阅,无需额外交易。您当前方案的所有剩余天数将自动转换为新方案的等值天数。您不会有任何损失,只需使用剩余金额即可升级到更高版本。这样,您的剩余订阅期限将会缩短,您的下次付款日期也会更改。了解如何升级年度订阅。
如果您降级,您当前的方案将保持不变,直至订阅日期。之后,当方案到期,新的降级方案将以所选费率生效。了解如何降级订阅。
NASDAQ,NYSE,NYSE ARCA,OTC,CME等交易所的所有额外实时和日内数据均可单独添加到您的账户。要添加数据,您首先需要购买我们的付费方案或成为试用会员。探索全球市场数据
不可以。额外的实时数据仅在TradingView网站上提供,并且仅适用于使用付费TradingView账户从符合条件的交易所购买数据的用户。