OPEN-SOURCE SCRIPT
Daily Key Levels + Weekly Year Opens v2.5 OPEN SOURCE
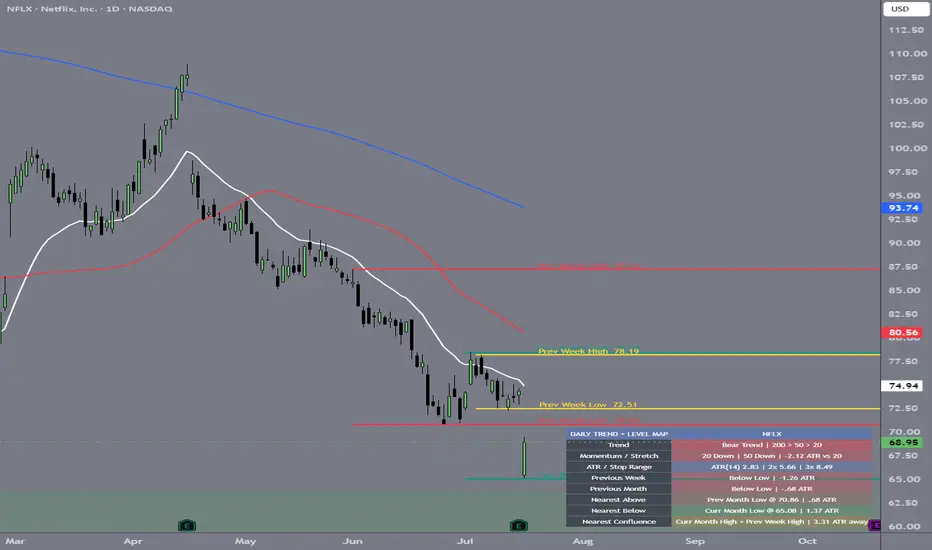
DAILY KEY LEVELS + WEEKLY YEAR OPENS
A clean higher-timeframe map that automatically changes with the chart.
AUTOMATIC DAILY AND WEEKLY PROFILES
This indicator is built specifically for 1D and 1W charts. It detects the chart timeframe and switches profiles automatically.
On a 1D chart, it displays the important weekly and monthly levels, the daily moving averages, and the Daily Trend + Level Map.
When the chart is changed to 1W, the daily profile is removed and the indicator automatically switches to the yearly-open profile. No manual setting changes are required when moving between daily and weekly charts.
On other timeframes, a small notice appears instead of displaying the wrong profile.
DAILY CHART PROFILE
The daily chart includes Previous Month High and Low, Current Month High and Low, and Previous Week High and Low. It also plots the 20 EMA in white, 50 SMA in red, and 200 SMA in blue.
Previous week and previous month levels are confirmed after those periods close. Current month levels continue developing as the month trades.
The compact dashboard adds practical context without taking over the chart. It shows:
Trend, based on price location and the exact order of the 20 EMA, 50 SMA, and 200 SMA.
Momentum / Stretch, including the direction of the 20 EMA and 50 SMA and price's distance from the 20 EMA in ATR units.
ATR / Stop Distance, showing the current daily ATR plus 2x and 3x ATR reference distances. These are volatility measurements, not automatic stop recommendations.
Previous Week and Previous Month, showing whether price is above, below, or inside each completed range.
Nearest Above, Nearest Below, and Nearest Confluence, identifying the closest enabled levels and measuring their distance in daily ATR.
WEEKLY CHART PROFILE
On a weekly chart, the indicator automatically displays the current yearly open and the previous four yearly opens.
By default, all yearly opens extend into the current chart area and include the calendar year and exact price. An optional Year Segments mode is available for traders who prefer each open to remain within its original calendar year.
PURPOSE
The daily profile provides a clear view of trend structure, volatility, nearby support and resistance, and level confluence. The weekly profile provides a simple long-term map of yearly opening prices.
Levels, colors, labels, moving averages, ATR settings, confluence distance, and dashboard placement can all be customized.
A clean higher-timeframe map that automatically changes with the chart.
AUTOMATIC DAILY AND WEEKLY PROFILES
This indicator is built specifically for 1D and 1W charts. It detects the chart timeframe and switches profiles automatically.
On a 1D chart, it displays the important weekly and monthly levels, the daily moving averages, and the Daily Trend + Level Map.
When the chart is changed to 1W, the daily profile is removed and the indicator automatically switches to the yearly-open profile. No manual setting changes are required when moving between daily and weekly charts.
On other timeframes, a small notice appears instead of displaying the wrong profile.
DAILY CHART PROFILE
The daily chart includes Previous Month High and Low, Current Month High and Low, and Previous Week High and Low. It also plots the 20 EMA in white, 50 SMA in red, and 200 SMA in blue.
Previous week and previous month levels are confirmed after those periods close. Current month levels continue developing as the month trades.
The compact dashboard adds practical context without taking over the chart. It shows:
Trend, based on price location and the exact order of the 20 EMA, 50 SMA, and 200 SMA.
Momentum / Stretch, including the direction of the 20 EMA and 50 SMA and price's distance from the 20 EMA in ATR units.
ATR / Stop Distance, showing the current daily ATR plus 2x and 3x ATR reference distances. These are volatility measurements, not automatic stop recommendations.
Previous Week and Previous Month, showing whether price is above, below, or inside each completed range.
Nearest Above, Nearest Below, and Nearest Confluence, identifying the closest enabled levels and measuring their distance in daily ATR.
WEEKLY CHART PROFILE
On a weekly chart, the indicator automatically displays the current yearly open and the previous four yearly opens.
By default, all yearly opens extend into the current chart area and include the calendar year and exact price. An optional Year Segments mode is available for traders who prefer each open to remain within its original calendar year.
PURPOSE
The daily profile provides a clear view of trend structure, volatility, nearby support and resistance, and level confluence. The weekly profile provides a simple long-term map of yearly opening prices.
Levels, colors, labels, moving averages, ATR settings, confluence distance, and dashboard placement can all be customized.
开源脚本
秉承TradingView的精神,该脚本的作者将其开源,以便交易者可以查看和验证其功能。向作者致敬!您可以免费使用该脚本,但请记住,重新发布代码须遵守我们的网站规则。

The Carny
免责声明
这些信息和出版物并非旨在提供,也不构成TradingView提供或认可的任何形式的财务、投资、交易或其他类型的建议或推荐。请阅读使用条款了解更多信息。
开源脚本
秉承TradingView的精神,该脚本的作者将其开源,以便交易者可以查看和验证其功能。向作者致敬!您可以免费使用该脚本,但请记住,重新发布代码须遵守我们的网站规则。
The Carny
免责声明
这些信息和出版物并非旨在提供,也不构成TradingView提供或认可的任何形式的财务、投资、交易或其他类型的建议或推荐。请阅读使用条款了解更多信息。