OPEN-SOURCE SCRIPT
已更新 Time Intervals (Bars)
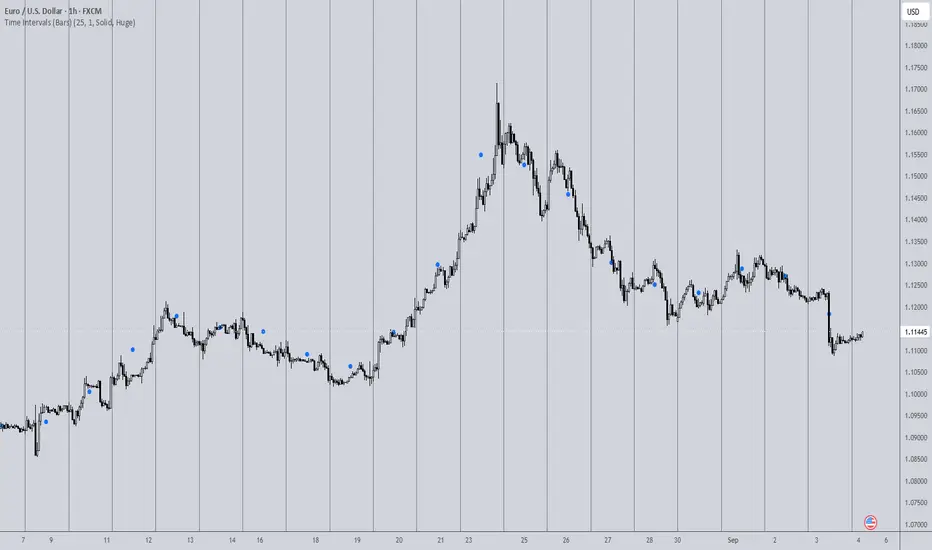
Bar Cycle Vertical Lines
This indicator provides a simple but powerful way to segment price action into consistent, repeatable intervals based on a user-defined number of bars. Each vertical line marks the start of a new cycle, allowing traders to visually break the chart into uniform “market rhythm blocks.”
Unlike time-based segmentation, this approach is fully bar-driven, meaning each cycle represents an equal amount of market interaction regardless of time or session conditions.
How It Works
• The user selects a fixed number of bars per cycle
• A vertical line is drawn every N bars
• These lines divide price action into equal structural segments
This creates a clean visual framework for analyzing repeating behavior in price.
How It Can Be Used
This tool is especially useful for evaluating market frequency in a practical, visual way:
• Identify how often structure shifts occur within fixed interaction intervals
• Compare expansion and compression behavior across equal bar cycles
• Study how trends evolve relative to consistent “market beats”
• Align other tools (such as oscillators or wave models) to cycle boundaries
• Evaluate whether price is accelerating or decelerating across repeating segments
By observing how price behaves between each cycle line, traders can begin to recognize repeating structural rhythm — or the absence of it.
Key Concept: Frequency Visualization
While the indicator is extremely simple, it becomes powerful when viewed through the lens of frequency:
• Tight clustering of movement between lines = high-frequency / choppy environment
• Strong directional movement across multiple cycles = low-frequency trending behavior
• Irregular behavior between cycles = unstable or transitional regimes
This makes it a lightweight but effective way to visually assess how “fast” or “slow” the market is behaving in structural terms.
Why It’s Useful
The strength of this indicator lies in its simplicity:
• No complex calculations
• No lagging signals
• No assumptions about price direction
Just clean, repeatable segmentation of market activity.
Despite its simplicity, it becomes a powerful analytical foundation when combined with other tools such as cycle waves, efficiency models, or structure-based systems.
Summary
This indicator turns price into a series of equal behavioral intervals, allowing traders to study frequency, rhythm, and structural consistency in a clean and intuitive way. It is intentionally minimal — designed not to predict, but to reveal how the market behaves over repeated cycles.
This indicator provides a simple but powerful way to segment price action into consistent, repeatable intervals based on a user-defined number of bars. Each vertical line marks the start of a new cycle, allowing traders to visually break the chart into uniform “market rhythm blocks.”
Unlike time-based segmentation, this approach is fully bar-driven, meaning each cycle represents an equal amount of market interaction regardless of time or session conditions.
How It Works
• The user selects a fixed number of bars per cycle
• A vertical line is drawn every N bars
• These lines divide price action into equal structural segments
This creates a clean visual framework for analyzing repeating behavior in price.
How It Can Be Used
This tool is especially useful for evaluating market frequency in a practical, visual way:
• Identify how often structure shifts occur within fixed interaction intervals
• Compare expansion and compression behavior across equal bar cycles
• Study how trends evolve relative to consistent “market beats”
• Align other tools (such as oscillators or wave models) to cycle boundaries
• Evaluate whether price is accelerating or decelerating across repeating segments
By observing how price behaves between each cycle line, traders can begin to recognize repeating structural rhythm — or the absence of it.
Key Concept: Frequency Visualization
While the indicator is extremely simple, it becomes powerful when viewed through the lens of frequency:
• Tight clustering of movement between lines = high-frequency / choppy environment
• Strong directional movement across multiple cycles = low-frequency trending behavior
• Irregular behavior between cycles = unstable or transitional regimes
This makes it a lightweight but effective way to visually assess how “fast” or “slow” the market is behaving in structural terms.
Why It’s Useful
The strength of this indicator lies in its simplicity:
• No complex calculations
• No lagging signals
• No assumptions about price direction
Just clean, repeatable segmentation of market activity.
Despite its simplicity, it becomes a powerful analytical foundation when combined with other tools such as cycle waves, efficiency models, or structure-based systems.
Summary
This indicator turns price into a series of equal behavioral intervals, allowing traders to study frequency, rhythm, and structural consistency in a clean and intuitive way. It is intentionally minimal — designed not to predict, but to reveal how the market behaves over repeated cycles.
版本注释
• Center markers added开源脚本
秉承TradingView的精神,该脚本的作者将其开源,以便交易者可以查看和验证其功能。向作者致敬!您可以免费使用该脚本,但请记住,重新发布代码须遵守我们的网站规则。

免责声明
这些信息和出版物并非旨在提供,也不构成TradingView提供或认可的任何形式的财务、投资、交易或其他类型的建议或推荐。请阅读使用条款了解更多信息。
开源脚本
秉承TradingView的精神,该脚本的作者将其开源,以便交易者可以查看和验证其功能。向作者致敬!您可以免费使用该脚本,但请记住,重新发布代码须遵守我们的网站规则。
免责声明
这些信息和出版物并非旨在提供,也不构成TradingView提供或认可的任何形式的财务、投资、交易或其他类型的建议或推荐。请阅读使用条款了解更多信息。