OPEN-SOURCE SCRIPT
TTP Universal Divergence Detector
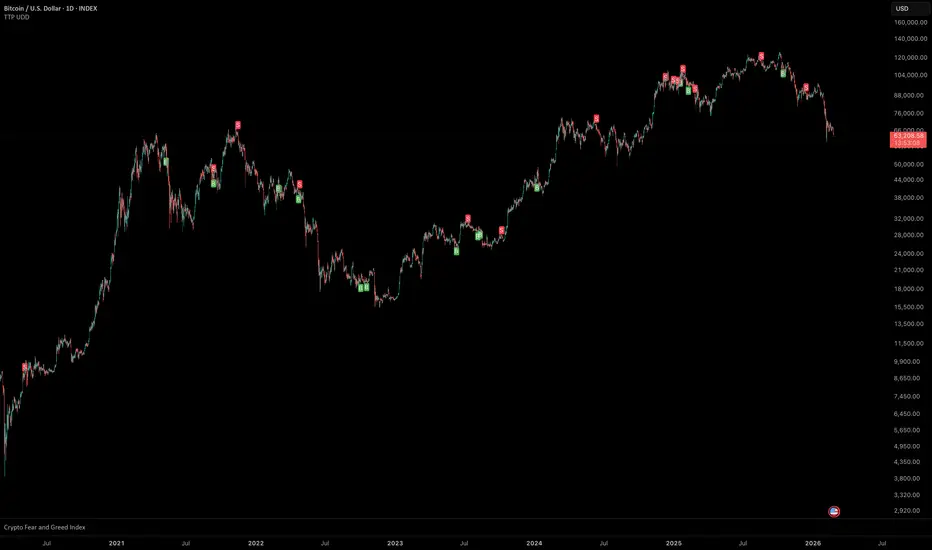
UNIVERSAL DIVERGENCE DETECTOR
═══════════════════════════════════════════════════════════════════════════════
OVERVIEW
The Universal Divergence Detector is a powerful and flexible indicator that identifies divergences between price action and ANY oscillator or indicator of your choice. Unlike traditional divergence indicators that only work with specific oscillators like RSI or MACD, this tool allows you to select any indicator on your chart as the source for divergence detection.
═══════════════════════════════════════════════════════════════════════════════
KEY FEATURES
UNIVERSAL COMPATIBILITY
→ Works with ANY indicator - RSI, MACD, Stochastic, Volume, custom indicators, or any other source
→ Flexible source selection - Choose your preferred indicator from a simple dropdown menu
→ Multi-timeframe capable - Use on any timeframe from 1-minute to monthly charts
COMPLETE DIVERGENCE DETECTION
The indicator detects all four types of divergences:
Regular Divergences (Potential Trend Reversals):
→ Regular Bullish: Price makes lower low, indicator makes higher low → Potential reversal UP
→ Regular Bearish: Price makes higher high, indicator makes lower high → Potential reversal DOWN
Hidden Divergences (Trend Continuation):
→ Hidden Bullish: Price makes higher low, indicator makes lower low → Continuation UP
→ Hidden Bearish: Price makes lower high, indicator makes higher high → Continuation DOWN
DUAL DISPLAY MODES
1. Divergences Only (Default)
→ Beautiful pattern lines connecting pivot points
→ Shows the complete divergence structure
→ WARNING: REPAINTS as new bars form - for analysis only, NOT for trading
2. Signals Only
→ Clean, simple B/S markers (Buy/Sell signals)
→ NON-REPAINTING - what you see is what you get
→ Appears when divergence is confirmed after pivot bars
→ Safe for trading and backtesting
3. Both
→ See the complete picture
→ Divergence lines show the historical pattern
→ Signal markers show exact entry points
BACKTESTING SUPPORT
→ Binary outputs (1/0) for each signal type
→ Non-repainting signals ensure reliable backtest results
→ Compatible with Pine Script strategies - reference the outputs in your own scripts
→ Six separate streams: Regular Bullish, Regular Bearish, Hidden Bullish, Hidden Bearish, Any Bullish, Any Bearish
COMPREHENSIVE ALERTS
→ Individual alerts for each divergence type
→ Combined alerts for any bullish/bearish signals
→ All alerts are NON-REPAINTING (signals only, not divergence patterns)
→ No false alerts from unconfirmed patterns
CUSTOMIZABLE VISUALS
→ Adjustable pivot sensitivity (left/right bars)
→ Customizable lookback range (min/max bars between pivots)
→ Color customization for each divergence type
→ Line width and label size controls
→ Toggle individual divergence types on/off
═══════════════════════════════════════════════════════════════════════════════
HOW TO USE
BASIC SETUP
1. Add the indicator to your chart
Click "Indicators" → Search "Universal Divergence Detector" → Add to chart
2. Select your indicator source
→ Open indicator settings
→ Under "Source Settings", click the "Indicator Source" dropdown
→ Choose ANY indicator already on your chart (e.g., RSI, MACD, Stochastic, etc.)
3. Configure pivot settings (optional)
→ Pivot Left Bars: Number of bars to the left of pivot (default: 5)
→ Pivot Right Bars: Number of bars to the right of pivot (default: 5)
→ Higher values = more reliable but slower signals
→ Signals appear AFTER right bars for confirmation
4. Choose your display mode
→ Divergences Only: Beautiful analysis view (repainting)
→ Signals Only: Clean trade signals (non-repainting)
→ Both: Complete picture
UNDERSTANDING THE DISPLAY
Divergence Lines (when enabled):
→ Solid lines = Regular divergences (potential reversals)
→ Dashed lines = Hidden divergences (trend continuation)
→ Labels: "RB" (Regular Bullish), "HB" (Hidden Bullish), etc.
Signal Markers (when enabled):
→ "B" = Buy signal (below bars)
→ "S" = Sell signal (above bars)
→ Colors:
• Green = Regular Bullish
• Red = Regular Bearish
• Blue = Hidden Bullish
• Orange = Hidden Bearish
TRADING STRATEGY TIPS
For Trend Reversals:
→ Enable Regular Divergences only
→ Use on higher timeframes (4H, Daily) for reliability
→ Wait for signal confirmation (B/S markers)
→ Combine with support/resistance levels
For Trend Continuation:
→ Enable Hidden Divergences only
→ Use in strong trending markets
→ Enter on pullbacks when hidden divergence appears
For Backtesting:
→ Enable "Backtesting Outputs" in settings
→ Use "Signals Only" display mode
→ Reference the binary outputs in your Pine Script strategy
→ Available outputs:
• BT: Regular Bullish Signal
• BT: Regular Bearish Signal
• BT: Hidden Bullish Signal
• BT: Hidden Bearish Signal
• BT: Any Bullish Signal
• BT: Any Bearish Signal
═══════════════════════════════════════════════════════════════════════════════
SETTINGS GUIDE
SOURCE SETTINGS
→ Indicator Source: Select which indicator to use for divergence detection
PIVOT SETTINGS
→ Pivot Left Bars (1-∞): Bars to the left of pivot point (default: 5)
→ Pivot Right Bars (1-∞): Bars to the right of pivot point (default: 5)
DIVERGENCE TYPES
Toggle each type individually:
→ Regular Bullish
→ Regular Bearish
→ Hidden Bullish
→ Hidden Bearish
DISPLAY SETTINGS
→ Display Mode: Divergences Only / Signals Only / Both
DETECTION SETTINGS
→ Max Lookback Bars (10-500): Maximum bars to search for divergence patterns (default: 60)
→ Min Lookback Bars (1-100): Minimum bars between pivots (default: 5)
BACKTESTING
→ Enable Backtesting Outputs: Turns on binary (1/0) plot streams for strategy development
VISUAL SETTINGS
→ Line Width (1-5): Thickness of divergence lines
→ Label Size: tiny / small / normal / large
COLORS
Customize colors for each divergence type:
→ Regular Bullish (default: Green)
→ Regular Bearish (default: Red)
→ Hidden Bullish (default: Blue)
→ Hidden Bearish (default: Orange)
═══════════════════════════════════════════════════════════════════════════════
IMPORTANT CONSIDERATIONS
REPAINTING VS NON-REPAINTING
DIVERGENCE LINES (Repainting):
→ Show beautiful historical patterns
→ Update as new bars form
→ Great for learning and analysis
→ NOT suitable for trading decisions
→ NOT suitable for backtesting
SIGNALS (Non-Repainting):
→ Appear on current bar when confirmed
→ What you see is what you get
→ Safe for trading
→ Reliable for backtesting
→ Appear AFTER pivot right bars (e.g., 5 bars delay with default settings)
This is why the indicator has two display modes - so you can see the pattern AND know exactly when you could have entered!
SIGNAL TIMING
With default settings (Pivot Right Bars = 5):
1. Price forms a pivot low at bar 100
2. Bars 101, 102, 103, 104, 105 form (5 bars of confirmation)
3. At bar 105, if divergence conditions are met, signal triggers
4. You enter your trade on bar 105 (the current bar)
The signal appears exactly when the divergence is mathematically confirmed - no earlier, no later.
BEST PRACTICES
DO:
→ Use signals for actual trading decisions
→ Combine with other analysis (support/resistance, trend lines)
→ Test different pivot settings for your timeframe
→ Use divergence lines for learning and pattern recognition
→ Enable backtesting outputs when developing strategies
DO NOT:
→ Trade based on divergence lines (they repaint)
→ Use very small pivot values (increases false signals)
→ Ignore the broader market context
→ Rely solely on divergences without confirmation
═══════════════════════════════════════════════════════════════════════════════
EXAMPLES
Example 1: RSI Divergence on Bitcoin
1. Add RSI indicator to your BTC chart
2. Add Universal Divergence Detector
3. Set source to RSI
4. Switch to "Both" display mode
5. Watch for regular bullish divergences at support levels
Example 2: MACD Divergence on Stocks
1. Add MACD indicator to your stock chart
2. Add Universal Divergence Detector
3. Set source to MACD (usually the MACD line, not signal line)
4. Enable only Regular divergences
5. Use on daily timeframe for swing trades
Example 3: Custom Indicator Divergence
1. Add your custom indicator (e.g., volume-weighted RSI)
2. Add Universal Divergence Detector
3. Set source to your custom indicator
4. Now you have divergence detection on your unique indicator!
═══════════════════════════════════════════════════════════════════════════════
TECHNICAL DETAILS
→ Pine Script Version: v6
→ Overlay: Yes (plots on price chart)
→ Max Labels: 500
→ Max Lines: 500
→ Calculation Method: Pivot-based using ta.pivothigh() and ta.pivotlow()
PERFORMANCE NOTES
→ Memory Efficient: Arrays limited to 100 pivots maximum
→ Calculation Speed: Optimized loops with configurable max lookback
→ Visual Performance: Toggle off unused divergence types for cleaner charts
═══════════════════════════════════════════════════════════════════════════════
TROUBLESHOOTING
No divergences showing?
→ Check that your selected source is actually plotted on the chart
→ Reduce Min Lookback Bars or increase Max Lookback Bars
→ Decrease Pivot Left/Right Bars for more sensitivity
Too many signals?
→ Increase Pivot Left/Right Bars for more selective detection
→ Increase Min Lookback Bars
→ Disable divergence types you don't need
Signals appear too late?
→ This is by design - signals need confirmation
→ Reduce Pivot Right Bars (but this increases false signals)
→ Remember: reliable signals require confirmation time
═══════════════════════════════════════════════════════════════════════════════
EDUCATIONAL RESOURCES
What is Divergence?
Divergence occurs when price action and an indicator move in opposite directions, suggesting potential momentum shifts.
Types of Divergences:
Regular Divergences suggest trend reversals:
→ Price continues in one direction
→ Indicator shows weakening momentum
→ Often occurs at major support/resistance
Hidden Divergences suggest trend continuation:
→ Price pulls back against the trend
→ Indicator shows momentum still strong
→ Often occurs during healthy pullbacks in trends
LEARNING MODE
To learn divergence patterns:
1. Set Display Mode to "Both"
2. Study historical charts
3. Notice how divergence lines show the pattern
4. See how signals appear after confirmation
5. Practice identifying divergences manually
6. Then switch to "Signals Only" for trading
═══════════════════════════════════════════════════════════════════════════════
FUTURE ENHANCEMENT IDEAS
Users can modify this open-source script to add:
→ Divergence strength scoring
→ Confluence with other indicators
→ Auto entry/exit strategy development
→ Multi-timeframe divergence detection
→ Volume-weighted divergence signals
═══════════════════════════════════════════════════════════════════════════════
Happy Trading!
Remember: The best indicator is the one you understand. Take time to learn how divergences work before incorporating them into your trading strategy.
═══════════════════════════════════════════════════════════════════════════════
═══════════════════════════════════════════════════════════════════════════════
OVERVIEW
The Universal Divergence Detector is a powerful and flexible indicator that identifies divergences between price action and ANY oscillator or indicator of your choice. Unlike traditional divergence indicators that only work with specific oscillators like RSI or MACD, this tool allows you to select any indicator on your chart as the source for divergence detection.
═══════════════════════════════════════════════════════════════════════════════
KEY FEATURES
UNIVERSAL COMPATIBILITY
→ Works with ANY indicator - RSI, MACD, Stochastic, Volume, custom indicators, or any other source
→ Flexible source selection - Choose your preferred indicator from a simple dropdown menu
→ Multi-timeframe capable - Use on any timeframe from 1-minute to monthly charts
COMPLETE DIVERGENCE DETECTION
The indicator detects all four types of divergences:
Regular Divergences (Potential Trend Reversals):
→ Regular Bullish: Price makes lower low, indicator makes higher low → Potential reversal UP
→ Regular Bearish: Price makes higher high, indicator makes lower high → Potential reversal DOWN
Hidden Divergences (Trend Continuation):
→ Hidden Bullish: Price makes higher low, indicator makes lower low → Continuation UP
→ Hidden Bearish: Price makes lower high, indicator makes higher high → Continuation DOWN
DUAL DISPLAY MODES
1. Divergences Only (Default)
→ Beautiful pattern lines connecting pivot points
→ Shows the complete divergence structure
→ WARNING: REPAINTS as new bars form - for analysis only, NOT for trading
2. Signals Only
→ Clean, simple B/S markers (Buy/Sell signals)
→ NON-REPAINTING - what you see is what you get
→ Appears when divergence is confirmed after pivot bars
→ Safe for trading and backtesting
3. Both
→ See the complete picture
→ Divergence lines show the historical pattern
→ Signal markers show exact entry points
BACKTESTING SUPPORT
→ Binary outputs (1/0) for each signal type
→ Non-repainting signals ensure reliable backtest results
→ Compatible with Pine Script strategies - reference the outputs in your own scripts
→ Six separate streams: Regular Bullish, Regular Bearish, Hidden Bullish, Hidden Bearish, Any Bullish, Any Bearish
COMPREHENSIVE ALERTS
→ Individual alerts for each divergence type
→ Combined alerts for any bullish/bearish signals
→ All alerts are NON-REPAINTING (signals only, not divergence patterns)
→ No false alerts from unconfirmed patterns
CUSTOMIZABLE VISUALS
→ Adjustable pivot sensitivity (left/right bars)
→ Customizable lookback range (min/max bars between pivots)
→ Color customization for each divergence type
→ Line width and label size controls
→ Toggle individual divergence types on/off
═══════════════════════════════════════════════════════════════════════════════
HOW TO USE
BASIC SETUP
1. Add the indicator to your chart
Click "Indicators" → Search "Universal Divergence Detector" → Add to chart
2. Select your indicator source
→ Open indicator settings
→ Under "Source Settings", click the "Indicator Source" dropdown
→ Choose ANY indicator already on your chart (e.g., RSI, MACD, Stochastic, etc.)
3. Configure pivot settings (optional)
→ Pivot Left Bars: Number of bars to the left of pivot (default: 5)
→ Pivot Right Bars: Number of bars to the right of pivot (default: 5)
→ Higher values = more reliable but slower signals
→ Signals appear AFTER right bars for confirmation
4. Choose your display mode
→ Divergences Only: Beautiful analysis view (repainting)
→ Signals Only: Clean trade signals (non-repainting)
→ Both: Complete picture
UNDERSTANDING THE DISPLAY
Divergence Lines (when enabled):
→ Solid lines = Regular divergences (potential reversals)
→ Dashed lines = Hidden divergences (trend continuation)
→ Labels: "RB" (Regular Bullish), "HB" (Hidden Bullish), etc.
Signal Markers (when enabled):
→ "B" = Buy signal (below bars)
→ "S" = Sell signal (above bars)
→ Colors:
• Green = Regular Bullish
• Red = Regular Bearish
• Blue = Hidden Bullish
• Orange = Hidden Bearish
TRADING STRATEGY TIPS
For Trend Reversals:
→ Enable Regular Divergences only
→ Use on higher timeframes (4H, Daily) for reliability
→ Wait for signal confirmation (B/S markers)
→ Combine with support/resistance levels
For Trend Continuation:
→ Enable Hidden Divergences only
→ Use in strong trending markets
→ Enter on pullbacks when hidden divergence appears
For Backtesting:
→ Enable "Backtesting Outputs" in settings
→ Use "Signals Only" display mode
→ Reference the binary outputs in your Pine Script strategy
→ Available outputs:
• BT: Regular Bullish Signal
• BT: Regular Bearish Signal
• BT: Hidden Bullish Signal
• BT: Hidden Bearish Signal
• BT: Any Bullish Signal
• BT: Any Bearish Signal
═══════════════════════════════════════════════════════════════════════════════
SETTINGS GUIDE
SOURCE SETTINGS
→ Indicator Source: Select which indicator to use for divergence detection
PIVOT SETTINGS
→ Pivot Left Bars (1-∞): Bars to the left of pivot point (default: 5)
→ Pivot Right Bars (1-∞): Bars to the right of pivot point (default: 5)
DIVERGENCE TYPES
Toggle each type individually:
→ Regular Bullish
→ Regular Bearish
→ Hidden Bullish
→ Hidden Bearish
DISPLAY SETTINGS
→ Display Mode: Divergences Only / Signals Only / Both
DETECTION SETTINGS
→ Max Lookback Bars (10-500): Maximum bars to search for divergence patterns (default: 60)
→ Min Lookback Bars (1-100): Minimum bars between pivots (default: 5)
BACKTESTING
→ Enable Backtesting Outputs: Turns on binary (1/0) plot streams for strategy development
VISUAL SETTINGS
→ Line Width (1-5): Thickness of divergence lines
→ Label Size: tiny / small / normal / large
COLORS
Customize colors for each divergence type:
→ Regular Bullish (default: Green)
→ Regular Bearish (default: Red)
→ Hidden Bullish (default: Blue)
→ Hidden Bearish (default: Orange)
═══════════════════════════════════════════════════════════════════════════════
IMPORTANT CONSIDERATIONS
REPAINTING VS NON-REPAINTING
DIVERGENCE LINES (Repainting):
→ Show beautiful historical patterns
→ Update as new bars form
→ Great for learning and analysis
→ NOT suitable for trading decisions
→ NOT suitable for backtesting
SIGNALS (Non-Repainting):
→ Appear on current bar when confirmed
→ What you see is what you get
→ Safe for trading
→ Reliable for backtesting
→ Appear AFTER pivot right bars (e.g., 5 bars delay with default settings)
This is why the indicator has two display modes - so you can see the pattern AND know exactly when you could have entered!
SIGNAL TIMING
With default settings (Pivot Right Bars = 5):
1. Price forms a pivot low at bar 100
2. Bars 101, 102, 103, 104, 105 form (5 bars of confirmation)
3. At bar 105, if divergence conditions are met, signal triggers
4. You enter your trade on bar 105 (the current bar)
The signal appears exactly when the divergence is mathematically confirmed - no earlier, no later.
BEST PRACTICES
DO:
→ Use signals for actual trading decisions
→ Combine with other analysis (support/resistance, trend lines)
→ Test different pivot settings for your timeframe
→ Use divergence lines for learning and pattern recognition
→ Enable backtesting outputs when developing strategies
DO NOT:
→ Trade based on divergence lines (they repaint)
→ Use very small pivot values (increases false signals)
→ Ignore the broader market context
→ Rely solely on divergences without confirmation
═══════════════════════════════════════════════════════════════════════════════
EXAMPLES
Example 1: RSI Divergence on Bitcoin
1. Add RSI indicator to your BTC chart
2. Add Universal Divergence Detector
3. Set source to RSI
4. Switch to "Both" display mode
5. Watch for regular bullish divergences at support levels
Example 2: MACD Divergence on Stocks
1. Add MACD indicator to your stock chart
2. Add Universal Divergence Detector
3. Set source to MACD (usually the MACD line, not signal line)
4. Enable only Regular divergences
5. Use on daily timeframe for swing trades
Example 3: Custom Indicator Divergence
1. Add your custom indicator (e.g., volume-weighted RSI)
2. Add Universal Divergence Detector
3. Set source to your custom indicator
4. Now you have divergence detection on your unique indicator!
═══════════════════════════════════════════════════════════════════════════════
TECHNICAL DETAILS
→ Pine Script Version: v6
→ Overlay: Yes (plots on price chart)
→ Max Labels: 500
→ Max Lines: 500
→ Calculation Method: Pivot-based using ta.pivothigh() and ta.pivotlow()
PERFORMANCE NOTES
→ Memory Efficient: Arrays limited to 100 pivots maximum
→ Calculation Speed: Optimized loops with configurable max lookback
→ Visual Performance: Toggle off unused divergence types for cleaner charts
═══════════════════════════════════════════════════════════════════════════════
TROUBLESHOOTING
No divergences showing?
→ Check that your selected source is actually plotted on the chart
→ Reduce Min Lookback Bars or increase Max Lookback Bars
→ Decrease Pivot Left/Right Bars for more sensitivity
Too many signals?
→ Increase Pivot Left/Right Bars for more selective detection
→ Increase Min Lookback Bars
→ Disable divergence types you don't need
Signals appear too late?
→ This is by design - signals need confirmation
→ Reduce Pivot Right Bars (but this increases false signals)
→ Remember: reliable signals require confirmation time
═══════════════════════════════════════════════════════════════════════════════
EDUCATIONAL RESOURCES
What is Divergence?
Divergence occurs when price action and an indicator move in opposite directions, suggesting potential momentum shifts.
Types of Divergences:
Regular Divergences suggest trend reversals:
→ Price continues in one direction
→ Indicator shows weakening momentum
→ Often occurs at major support/resistance
Hidden Divergences suggest trend continuation:
→ Price pulls back against the trend
→ Indicator shows momentum still strong
→ Often occurs during healthy pullbacks in trends
LEARNING MODE
To learn divergence patterns:
1. Set Display Mode to "Both"
2. Study historical charts
3. Notice how divergence lines show the pattern
4. See how signals appear after confirmation
5. Practice identifying divergences manually
6. Then switch to "Signals Only" for trading
═══════════════════════════════════════════════════════════════════════════════
FUTURE ENHANCEMENT IDEAS
Users can modify this open-source script to add:
→ Divergence strength scoring
→ Confluence with other indicators
→ Auto entry/exit strategy development
→ Multi-timeframe divergence detection
→ Volume-weighted divergence signals
═══════════════════════════════════════════════════════════════════════════════
Happy Trading!
Remember: The best indicator is the one you understand. Take time to learn how divergences work before incorporating them into your trading strategy.
═══════════════════════════════════════════════════════════════════════════════
开源脚本
秉承TradingView的精神,该脚本的作者将其开源,以便交易者可以查看和验证其功能。向作者致敬!您可以免费使用该脚本,但请记住,重新发布代码须遵守我们的网站规则。

Join our membership to gain access to the private scripts.
patreon.com/c/thetradingparrot
patreon.com/c/thetradingparrot
免责声明
这些信息和出版物并非旨在提供,也不构成TradingView提供或认可的任何形式的财务、投资、交易或其他类型的建议或推荐。请阅读使用条款了解更多信息。
开源脚本
秉承TradingView的精神,该脚本的作者将其开源,以便交易者可以查看和验证其功能。向作者致敬!您可以免费使用该脚本,但请记住,重新发布代码须遵守我们的网站规则。
Join our membership to gain access to the private scripts.
patreon.com/c/thetradingparrot
patreon.com/c/thetradingparrot
免责声明
这些信息和出版物并非旨在提供,也不构成TradingView提供或认可的任何形式的财务、投资、交易或其他类型的建议或推荐。请阅读使用条款了解更多信息。