US Macro Release Days with Measured First Hour
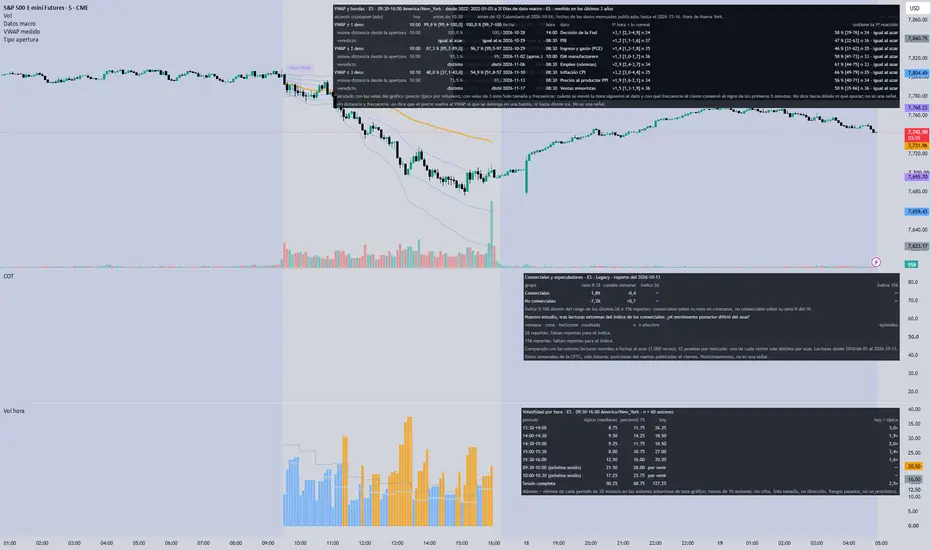
Marks the scheduled US economic releases of the coming weeks on the chart (CPI, payrolls, PPI, retail sales, GDP, PCE, the Fed decision and ISM manufacturing) at their New York time, and for the chart's market shows how much the first hour after each release moved against a normal hour and how often the session close kept the first reaction, each figure with its sample size.
WHAT IT SHOWS
- Dotted vertical lines with a label at each scheduled release, up to 500 bars ahead.
- A table: date, time, release, first-hour range as a multiple of a normal hour (with its interval and n) and the share of releases in which the close kept the side of the first reaction (with its interval and n). When the interval holds 1x (size) or 50% (held reaction), it reads "same as chance". The side of the reaction is never shown.
- The date the calendar was built, so it is clear when the script needs an update to see newer dates.
HOW IT WORKS
- The calendar and the statistics are embedded from our own data, measured over the last 3 years of 1-minute bars of the market, and refreshed with each update of the script. Dates labelled "est." are estimated; ISM is placed on the first business day of the month and labelled "approx.".
LIMITS
- Size, frequency and time only. It does not say which way a release moves the market and it is not a signal or a recommendation.
- Release dates can change; check the official calendar of each agency.
Languages: Spanish, English and Portuguese (input). Alert: release in 30 minutes.
WHAT IT SHOWS
- Dotted vertical lines with a label at each scheduled release, up to 500 bars ahead.
- A table: date, time, release, first-hour range as a multiple of a normal hour (with its interval and n) and the share of releases in which the close kept the side of the first reaction (with its interval and n). When the interval holds 1x (size) or 50% (held reaction), it reads "same as chance". The side of the reaction is never shown.
- The date the calendar was built, so it is clear when the script needs an update to see newer dates.
HOW IT WORKS
- The calendar and the statistics are embedded from our own data, measured over the last 3 years of 1-minute bars of the market, and refreshed with each update of the script. Dates labelled "est." are estimated; ISM is placed on the first business day of the month and labelled "approx.".
LIMITS
- Size, frequency and time only. It does not say which way a release moves the market and it is not a signal or a recommendation.
- Release dates can change; check the official calendar of each agency.
Languages: Spanish, English and Portuguese (input). Alert: release in 30 minutes.

Perfiltrade — futures analysis with the sample in plain sight: historical base rates, Market Profile and COT across 30 instruments. No signals, no black boxes. perfiltrade.com
免责声明
这些信息和出版物并非旨在提供,也不构成TradingView提供或认可的任何形式的财务、投资、交易或其他类型的建议或推荐。请阅读使用条款了解更多信息。
Perfiltrade — futures analysis with the sample in plain sight: historical base rates, Market Profile and COT across 30 instruments. No signals, no black boxes. perfiltrade.com
免责声明
这些信息和出版物并非旨在提供,也不构成TradingView提供或认可的任何形式的财务、投资、交易或其他类型的建议或推荐。请阅读使用条款了解更多信息。