OPEN-SOURCE SCRIPT
Macro Clock Overlap 166/186/208) Anchored (v6)
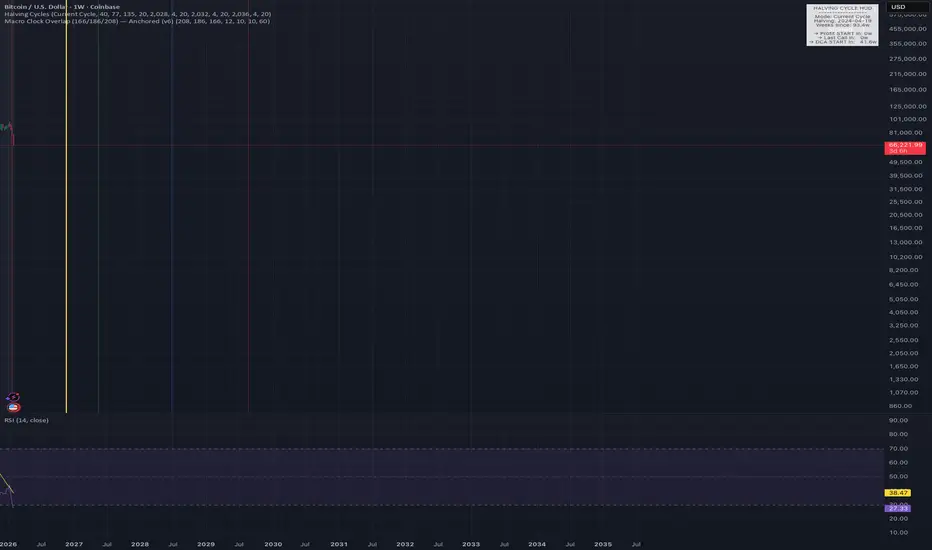
Macro Clock Overlap is a time-based market structure overlay designed to visualize cyclical pressure zones created by the interaction of three independent macro clocks:
166 weeks — Momentum / expansion cycle (anchored to a major weekly RSI peak)
186 weeks — Capitulation / contraction cycle (anchored to a weekly RSI < 30 trough)
208 weeks — Bitcoin halving cycle (protocol-defined supply shock)
Rather than attempting to predict price, this indicator highlights periods of structural instability where multiple cycles overlap — conditions that historically coincide with increased volatility, regime shifts, and non-linear market behavior.
How it works
Each cycle is projected forward and backward from a fixed anchor date.
Around each projected event, a configurable time window (± weeks) is applied.
For every bar, the script computes an Overlap Score (0–3):
0 — No active macro cycles
1 — Single cycle influence
2 — Reinforced cycle overlap (heightened instability)
3 — Rare full convergence (maximum structural stress)
The background shading reflects the current overlap score, and optional vertical lines mark projected cycle events for each clock.
What this indicator is (and isn’t)
✔ A probabilistic timing framework
✔ A way to identify volatility expansion and transition zones
✔ Useful for risk management, position sizing, and expectation setting
✘ Not a price prediction tool
✘ Not a buy/sell signal generator
✘ Not curve-fitted to price action
This tool is best used in conjunction with price structure, trend, and momentum analysis.
Customization
Anchor dates can be adjusted from the settings panel
Cycle lengths and window sizes are fully configurable
Visuals (background shading, vertical lines, table) can be toggled on/off
Designed for weekly charts, but works on any timeframe with macro intent.
Philosophy
Markets are not governed by a single clock.
They evolve through the interaction of multiple rhythms — internal momentum, stress accumulation, and external shocks.
Macro Clock Overlap makes those rhythms visible.
166 weeks — Momentum / expansion cycle (anchored to a major weekly RSI peak)
186 weeks — Capitulation / contraction cycle (anchored to a weekly RSI < 30 trough)
208 weeks — Bitcoin halving cycle (protocol-defined supply shock)
Rather than attempting to predict price, this indicator highlights periods of structural instability where multiple cycles overlap — conditions that historically coincide with increased volatility, regime shifts, and non-linear market behavior.
How it works
Each cycle is projected forward and backward from a fixed anchor date.
Around each projected event, a configurable time window (± weeks) is applied.
For every bar, the script computes an Overlap Score (0–3):
0 — No active macro cycles
1 — Single cycle influence
2 — Reinforced cycle overlap (heightened instability)
3 — Rare full convergence (maximum structural stress)
The background shading reflects the current overlap score, and optional vertical lines mark projected cycle events for each clock.
What this indicator is (and isn’t)
✔ A probabilistic timing framework
✔ A way to identify volatility expansion and transition zones
✔ Useful for risk management, position sizing, and expectation setting
✘ Not a price prediction tool
✘ Not a buy/sell signal generator
✘ Not curve-fitted to price action
This tool is best used in conjunction with price structure, trend, and momentum analysis.
Customization
Anchor dates can be adjusted from the settings panel
Cycle lengths and window sizes are fully configurable
Visuals (background shading, vertical lines, table) can be toggled on/off
Designed for weekly charts, but works on any timeframe with macro intent.
Philosophy
Markets are not governed by a single clock.
They evolve through the interaction of multiple rhythms — internal momentum, stress accumulation, and external shocks.
Macro Clock Overlap makes those rhythms visible.
开源脚本
秉承TradingView的精神,该脚本的作者将其开源,以便交易者可以查看和验证其功能。向作者致敬!您可以免费使用该脚本,但请记住,重新发布代码须遵守我们的网站规则。

免责声明
这些信息和出版物并非旨在提供,也不构成TradingView提供或认可的任何形式的财务、投资、交易或其他类型的建议或推荐。请阅读使用条款了解更多信息。
免责声明
这些信息和出版物并非旨在提供,也不构成TradingView提供或认可的任何形式的财务、投资、交易或其他类型的建议或推荐。请阅读使用条款了解更多信息。