OPEN-SOURCE SCRIPT
已更新 ATR Stop - w/TP & Stats
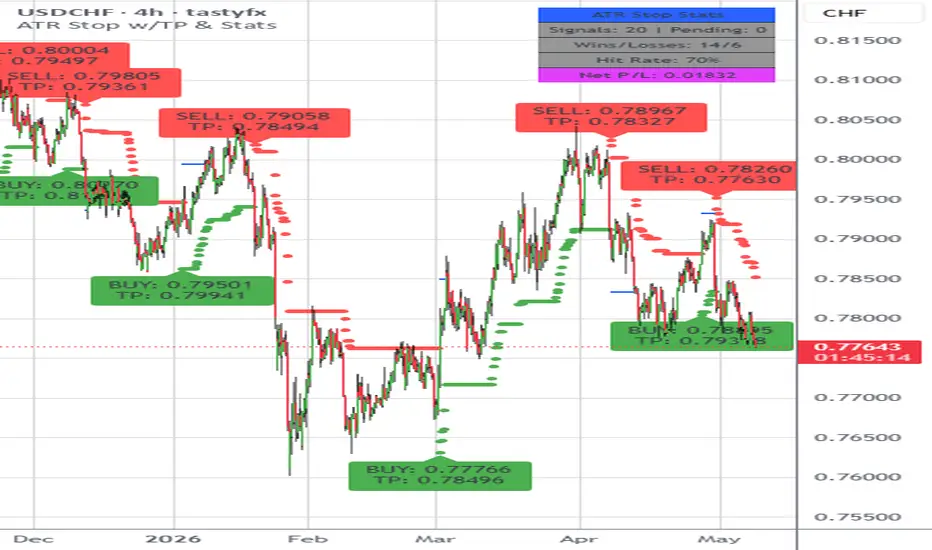
ATR Stop – With Take Profit & Performance Stats
This indicator builds on the classic ATR trailing stop concept by adding automated take-profit targets, signal tracking, and real-time performance statistics directly on the chart.
It is designed to help traders visualize trend reversals, trade targets, and historical signal performance without needing a separate strategy backtest.
Indicator Overview
The script calculates a dynamic trailing stop using Average True Range (ATR).
When price crosses the stop level, a BUY or SELL signal is generated.
Each signal automatically receives a take-profit level based on ATR, and the indicator tracks whether the trade:
Hits the TP → Win
Gets replaced by a new signal before TP → Loss
Is still active → Pending
A statistics panel summarizes the results of recent signals.
Core Features
ATR Trailing Stop System
Uses ATR to dynamically calculate a trailing stop.
Stop flips direction when price crosses it.
Provides clear visual trend direction.
Automatic Buy / Sell Signals
BUY when price crosses above the ATR stop.
SELL when price crosses below the ATR stop.
Optional non-repainting confirmation on candle close.
ATR-Based Take Profit Targets
Each signal creates a take-profit level based on ATR multiple.
TP lines extend while the trade is active.
When TP is hit, the trade is marked as a win.
Signal Outcome Tracking
Trades are categorized as:
Win → TP reached
Loss → Opposite signal appears before TP
Pending → TP not yet reached
This allows quick evaluation of signal quality.
Performance Statistics Panel
Displays real-time statistics including:
Total signals
Pending trades
Wins and losses
Hit rate %
Statistics are calculated from the most recent signals defined by the lookback setting.
Chart Visualization
ATR stop plotted on chart
BUY / SELL labels with TP price
Optional TP lines
Optional bar coloring based on trend direction
Key Inputs
ATR Period
Length used for ATR calculation.
ATR Multiplier
Distance of the trailing stop from price.
Take Profit ATR Multiplier
Distance of TP level relative to ATR.
Lookback Closed Trades
Number of completed trades included in statistics.
Non-Repainting Signals
Signals only trigger on confirmed candle closes.
Show Take Profit Lines
Toggle visibility of TP lines.
Bar Coloring
Color candles based on ATR stop direction.
How Trade Outcomes Are Determined
Signal appears
TP level is calculated using ATR
Trade remains pending
One of two events resolves the trade:
TP Hit
Trade counted as Win
Opposite Signal Before TP
Previous trade counted as Loss
What Makes This Indicator Useful
Combines trend detection + trade management
Provides visual TP targets
Tracks signal performance automatically
Maintains clean charts using rolling lookback statistics
Designed for manual trading analysis and signal validation
Alerts
Two alert conditions are included:
Buy Signal
Sell Signal
These can be used to trigger TradingView alerts or automation workflows.
Typical Use Cases
Trend following strategies
ATR-based trade management
Signal quality evaluation
Visual backtesting
Entry/exit reference levels
This indicator builds on the classic ATR trailing stop concept by adding automated take-profit targets, signal tracking, and real-time performance statistics directly on the chart.
It is designed to help traders visualize trend reversals, trade targets, and historical signal performance without needing a separate strategy backtest.
Indicator Overview
The script calculates a dynamic trailing stop using Average True Range (ATR).
When price crosses the stop level, a BUY or SELL signal is generated.
Each signal automatically receives a take-profit level based on ATR, and the indicator tracks whether the trade:
Hits the TP → Win
Gets replaced by a new signal before TP → Loss
Is still active → Pending
A statistics panel summarizes the results of recent signals.
Core Features
ATR Trailing Stop System
Uses ATR to dynamically calculate a trailing stop.
Stop flips direction when price crosses it.
Provides clear visual trend direction.
Automatic Buy / Sell Signals
BUY when price crosses above the ATR stop.
SELL when price crosses below the ATR stop.
Optional non-repainting confirmation on candle close.
ATR-Based Take Profit Targets
Each signal creates a take-profit level based on ATR multiple.
TP lines extend while the trade is active.
When TP is hit, the trade is marked as a win.
Signal Outcome Tracking
Trades are categorized as:
Win → TP reached
Loss → Opposite signal appears before TP
Pending → TP not yet reached
This allows quick evaluation of signal quality.
Performance Statistics Panel
Displays real-time statistics including:
Total signals
Pending trades
Wins and losses
Hit rate %
Statistics are calculated from the most recent signals defined by the lookback setting.
Chart Visualization
ATR stop plotted on chart
BUY / SELL labels with TP price
Optional TP lines
Optional bar coloring based on trend direction
Key Inputs
ATR Period
Length used for ATR calculation.
ATR Multiplier
Distance of the trailing stop from price.
Take Profit ATR Multiplier
Distance of TP level relative to ATR.
Lookback Closed Trades
Number of completed trades included in statistics.
Non-Repainting Signals
Signals only trigger on confirmed candle closes.
Show Take Profit Lines
Toggle visibility of TP lines.
Bar Coloring
Color candles based on ATR stop direction.
How Trade Outcomes Are Determined
Signal appears
TP level is calculated using ATR
Trade remains pending
One of two events resolves the trade:
TP Hit
Trade counted as Win
Opposite Signal Before TP
Previous trade counted as Loss
What Makes This Indicator Useful
Combines trend detection + trade management
Provides visual TP targets
Tracks signal performance automatically
Maintains clean charts using rolling lookback statistics
Designed for manual trading analysis and signal validation
Alerts
Two alert conditions are included:
Buy Signal
Sell Signal
These can be used to trigger TradingView alerts or automation workflows.
Typical Use Cases
Trend following strategies
ATR-based trade management
Signal quality evaluation
Visual backtesting
Entry/exit reference levels
版本注释
Updated by adding a checkbox for TP visuals on inputs tab.版本注释
Updated Stats added Net P/L.版本注释
Added user functionality.Updated label display.
Updated stats window with user controls.
版本注释
Pine category updated.开源脚本
秉承TradingView的精神,该脚本的作者将其开源,以便交易者可以查看和验证其功能。向作者致敬!您可以免费使用该脚本,但请记住,重新发布代码须遵守我们的网站规则。

免责声明
这些信息和出版物并非旨在提供,也不构成TradingView提供或认可的任何形式的财务、投资、交易或其他类型的建议或推荐。请阅读使用条款了解更多信息。
免责声明
这些信息和出版物并非旨在提供,也不构成TradingView提供或认可的任何形式的财务、投资、交易或其他类型的建议或推荐。请阅读使用条款了解更多信息。