OPEN-SOURCE SCRIPT
RSI with Bullish/ Bearish Zones by VKK
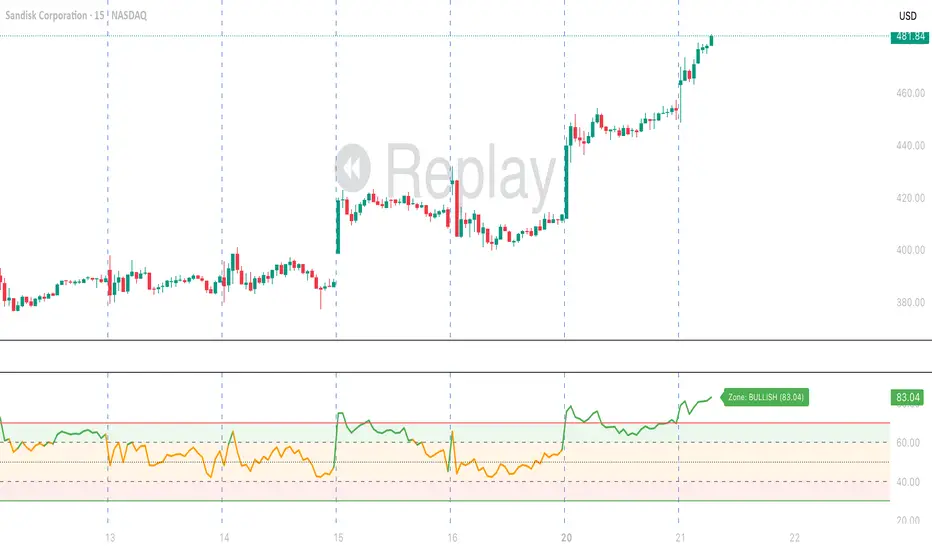
Disclaimer: Script is not suggesting any buy or sell any stock. It's a visual identification of the direction of the current state of the stock.
This script is a modified Relative Strength Index (RSI) designed to help traders filter out market noise by identifying three distinct momentum phases. Instead of the traditional 70/30 approach, this version uses the 40 and 60 levels to define a "Neutral/Caution" zone.
Key Features:
🟢 Bullish Zone (Above 60): Indicates strong upward momentum. The RSI line turns green, signaling a potential trend continuation.
🟠 Caution Zone (40–60): A neutral "no-man's land" where the market is often consolidating or undecided. The line turns orange, warning traders to be patient.
🔴 Bearish Zone (Below 40): Indicates strong downward momentum. The RSI line turns red, signaling a potential downtrend.
⚖️ Midline (50): A blue or your color choice dotted line acts as the ultimate pivot point between buyers and sellers.
🔥 Extremes (70/30): Classic Overbought (Red) and Oversold (Green) levels are included for mean-reversion context.
How to Use:
Trend Confirmation: Look for the RSI to sustain a position above 60 for longs or below 40 for shorts.
Filter Noise: Avoid entering aggressive trend trades when the RSI is stuck in the Orange Caution Zone.
Real-time Status: The dynamic label on the right provides an instant reading of the current market state and exact RSI value.
This script is a modified Relative Strength Index (RSI) designed to help traders filter out market noise by identifying three distinct momentum phases. Instead of the traditional 70/30 approach, this version uses the 40 and 60 levels to define a "Neutral/Caution" zone.
Key Features:
🟢 Bullish Zone (Above 60): Indicates strong upward momentum. The RSI line turns green, signaling a potential trend continuation.
🟠 Caution Zone (40–60): A neutral "no-man's land" where the market is often consolidating or undecided. The line turns orange, warning traders to be patient.
🔴 Bearish Zone (Below 40): Indicates strong downward momentum. The RSI line turns red, signaling a potential downtrend.
⚖️ Midline (50): A blue or your color choice dotted line acts as the ultimate pivot point between buyers and sellers.
🔥 Extremes (70/30): Classic Overbought (Red) and Oversold (Green) levels are included for mean-reversion context.
How to Use:
Trend Confirmation: Look for the RSI to sustain a position above 60 for longs or below 40 for shorts.
Filter Noise: Avoid entering aggressive trend trades when the RSI is stuck in the Orange Caution Zone.
Real-time Status: The dynamic label on the right provides an instant reading of the current market state and exact RSI value.
开源脚本
秉承TradingView的精神,该脚本的作者将其开源,以便交易者可以查看和验证其功能。向作者致敬!您可以免费使用该脚本,但请记住,重新发布代码须遵守我们的网站规则。

免责声明
这些信息和出版物并非旨在提供,也不构成TradingView提供或认可的任何形式的财务、投资、交易或其他类型的建议或推荐。请阅读使用条款了解更多信息。
免责声明
这些信息和出版物并非旨在提供,也不构成TradingView提供或认可的任何形式的财务、投资、交易或其他类型的建议或推荐。请阅读使用条款了解更多信息。