OPEN-SOURCE SCRIPT
Previous ATR SandFx
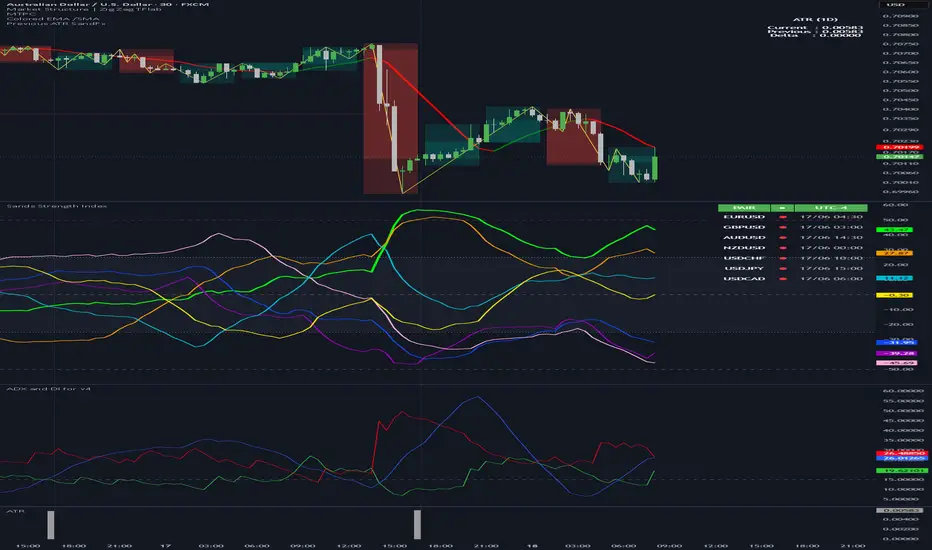
📊 Previous ATR Clean Indicator
Previous ATR Clean is a simple indicator designed to monitor market volatility changes by comparing the current candle ATR (Current ATR) with the previous candle ATR (Previous ATR). ATR (Average True Range) measures the size of price movement, not the direction of the trend. This indicator helps traders identify whether the market is experiencing volatility expansion (increasing movement) or volatility contraction (decreasing movement).
Current ATR shows the current market volatility condition. Previous ATR shows the volatility from the previous candle as a comparison. Delta ATR represents the difference between them:
Delta = Current ATR - Previous ATR
If Delta is positive (+), it means ATR is increasing → candle range is expanding → the market is gaining energy and momentum. This condition often appears during breakouts or when a trend starts developing.
If Delta is negative (-), it means ATR is decreasing → candle range is shrinking → the market is losing energy or entering a consolidation phase.
This indicator can be used to:
✅ Identify whether the market is active or slow
✅ Measure breakout strength
✅ Avoid entries during low volatility conditions
✅ Adjust stop loss and target distance based on market conditions
Example:
Current ATR: 3.50
Previous ATR: 2.80
Delta: +0.70
Meaning: volatility is increasing and the market is expanding.
Current ATR: 2.50
Previous ATR: 3.20
Delta: -0.70
Meaning: volatility is decreasing and the market is slowing down.
ATR does not provide buy or sell signals. It helps traders understand market energy and volatility conditions. Combine it with other analysis tools such as market structure, support & resistance, volume, or trend direction for better trading decisions.
Trade with volatility, not against it. 📈
Previous ATR Clean is a simple indicator designed to monitor market volatility changes by comparing the current candle ATR (Current ATR) with the previous candle ATR (Previous ATR). ATR (Average True Range) measures the size of price movement, not the direction of the trend. This indicator helps traders identify whether the market is experiencing volatility expansion (increasing movement) or volatility contraction (decreasing movement).
Current ATR shows the current market volatility condition. Previous ATR shows the volatility from the previous candle as a comparison. Delta ATR represents the difference between them:
Delta = Current ATR - Previous ATR
If Delta is positive (+), it means ATR is increasing → candle range is expanding → the market is gaining energy and momentum. This condition often appears during breakouts or when a trend starts developing.
If Delta is negative (-), it means ATR is decreasing → candle range is shrinking → the market is losing energy or entering a consolidation phase.
This indicator can be used to:
✅ Identify whether the market is active or slow
✅ Measure breakout strength
✅ Avoid entries during low volatility conditions
✅ Adjust stop loss and target distance based on market conditions
Example:
Current ATR: 3.50
Previous ATR: 2.80
Delta: +0.70
Meaning: volatility is increasing and the market is expanding.
Current ATR: 2.50
Previous ATR: 3.20
Delta: -0.70
Meaning: volatility is decreasing and the market is slowing down.
ATR does not provide buy or sell signals. It helps traders understand market energy and volatility conditions. Combine it with other analysis tools such as market structure, support & resistance, volume, or trend direction for better trading decisions.
Trade with volatility, not against it. 📈
开源脚本
秉承TradingView的精神,该脚本的作者将其开源,以便交易者可以查看和验证其功能。向作者致敬!您可以免费使用该脚本,但请记住,重新发布代码须遵守我们的网站规则。

免责声明
这些信息和出版物并非旨在提供,也不构成TradingView提供或认可的任何形式的财务、投资、交易或其他类型的建议或推荐。请阅读使用条款了解更多信息。
免责声明
这些信息和出版物并非旨在提供,也不构成TradingView提供或认可的任何形式的财务、投资、交易或其他类型的建议或推荐。请阅读使用条款了解更多信息。