Legkomolyabb skalp indikator
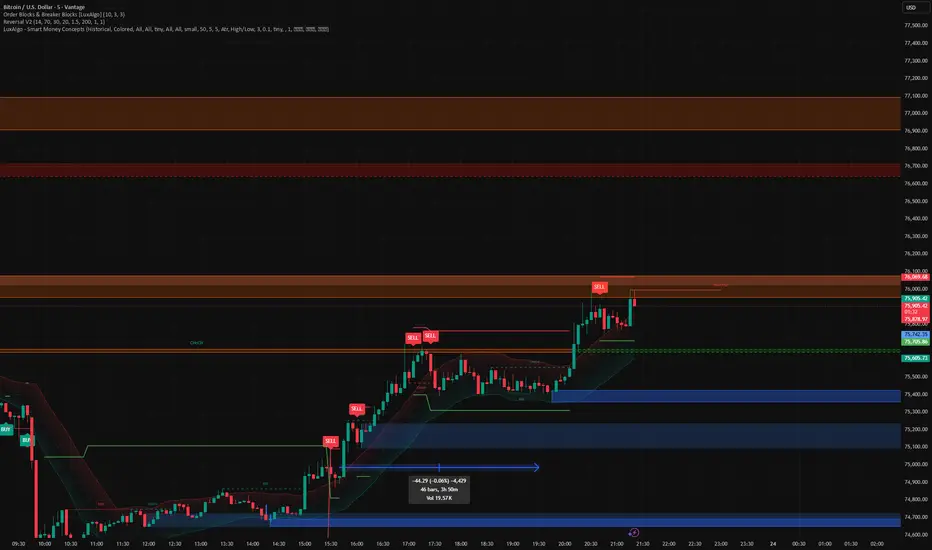
The main components of the script:
Triple Confirmation (Strategy)
Price exhaustion: The price moves outside ATR-based bands (overextended movement).
Momentum extreme: The RSI gives an overbought or oversold signal.
Structural reversal: A signal is only generated once a Pivot point (swing high or swing low) forms, confirming the reversal.
Trend Filter (EMA 200)
I integrated a 200 EMA. By default, you only receive:
Buy signals when the price is above the EMA (buying pullbacks in an uptrend),
Sell signals when the price is below the EMA.
This helps avoid losing trades against the main trend.
Risk Management (SL/TP)
The system automatically calculates the Stop-Loss level using ATR (volatility-based), giving the trade enough room to breathe.
The Take-Profit level is set automatically according to the selected risk/reward ratio (default: 1:2).
How to use it on the chart
Green triangles indicate buy opportunities.
Red triangles indicate sell opportunities.
The dashed/solid lines (red and green) show suggested exit levels after entry.
You can fine-tune the RSI levels or the trend filter anytime in the settings menu (gear icon).
Tip
If you use it on highly volatile markets (such as crypto), it’s recommended to increase the ATR multiplier (“Volatility Multiplier”) to 2.5 or 3.0 so the system only signals truly extreme exhaustion moves.
Triple Confirmation (Strategy)
Price exhaustion: The price moves outside ATR-based bands (overextended movement).
Momentum extreme: The RSI gives an overbought or oversold signal.
Structural reversal: A signal is only generated once a Pivot point (swing high or swing low) forms, confirming the reversal.
Trend Filter (EMA 200)
I integrated a 200 EMA. By default, you only receive:
Buy signals when the price is above the EMA (buying pullbacks in an uptrend),
Sell signals when the price is below the EMA.
This helps avoid losing trades against the main trend.
Risk Management (SL/TP)
The system automatically calculates the Stop-Loss level using ATR (volatility-based), giving the trade enough room to breathe.
The Take-Profit level is set automatically according to the selected risk/reward ratio (default: 1:2).
How to use it on the chart
Green triangles indicate buy opportunities.
Red triangles indicate sell opportunities.
The dashed/solid lines (red and green) show suggested exit levels after entry.
You can fine-tune the RSI levels or the trend filter anytime in the settings menu (gear icon).
Tip
If you use it on highly volatile markets (such as crypto), it’s recommended to increase the ATR multiplier (“Volatility Multiplier”) to 2.5 or 3.0 so the system only signals truly extreme exhaustion moves.

免责声明
这些信息和出版物并非旨在提供,也不构成TradingView提供或认可的任何形式的财务、投资、交易或其他类型的建议或推荐。请阅读使用条款了解更多信息。
免责声明
这些信息和出版物并非旨在提供,也不构成TradingView提供或认可的任何形式的财务、投资、交易或其他类型的建议或推荐。请阅读使用条款了解更多信息。